|
Download Data (XLS File) |
|
|||||
|
|||||
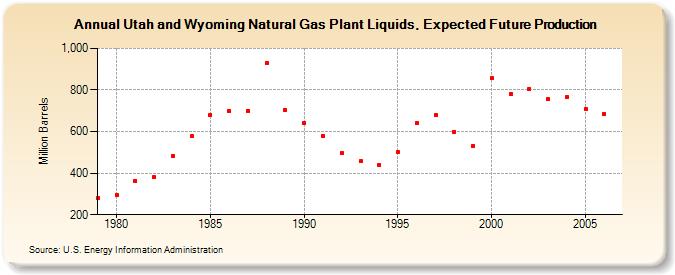
| Utah and Wyoming Natural Gas Plant Liquids, Expected Future Production (Million Barrels) | |||||
| Decade | Year-0 | Year-1 | Year-2 | Year-3 | Year-4 | Year-5 | Year-6 | Year-7 | Year-8 | Year-9 |
|---|---|---|---|---|---|---|---|---|---|---|
| 1970's | 280 | |||||||||
| 1980's | 294 | 363 | 381 | 483 | 577 | 681 | 700 | 701 | 932 | 704 |
| 1990's | 641 | 580 | 497 | 458 | 440 | 503 | 639 | 680 | 600 | 531 |
| 2000's | 858 | 782 | 806 | 756 | 765 | 710 | 686 |
| - = No Data Reported; -- = Not Applicable; NA = Not Available; W = Withheld to avoid disclosure of individual company data. |
| Release Date: 12/30/2022 |
| Next Release Date: NA |
Referring Pages: