|
Download Data (XLS File) |
|
||||||||
|
||||||||
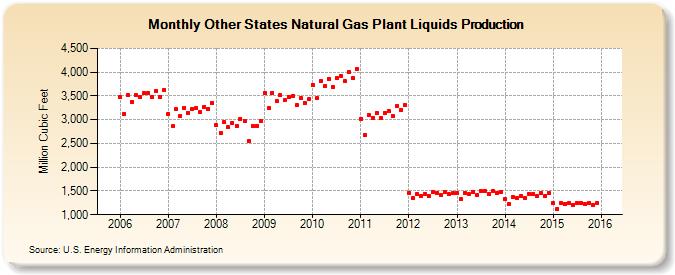
| Other States Natural Gas Plant Liquids Production (Million Cubic Feet) | ||||||||
| Year | Jan | Feb | Mar | Apr | May | Jun | Jul | Aug | Sep | Oct | Nov | Dec |
|---|---|---|---|---|---|---|---|---|---|---|---|---|
| 2006 | 3,468 | 3,124 | 3,512 | 3,381 | 3,514 | 3,475 | 3,553 | 3,565 | 3,482 | 3,607 | 3,478 | 3,628 |
| 2007 | 3,122 | 2,860 | 3,218 | 3,073 | 3,255 | 3,149 | 3,218 | 3,236 | 3,164 | 3,275 | 3,235 | 3,354 |
| 2008 | 2,881 | 2,719 | 2,944 | 2,840 | 2,934 | 2,874 | 3,024 | 2,981 | 2,544 | 2,863 | 2,869 | 2,982 |
| 2009 | 3,562 | 3,246 | 3,570 | 3,396 | 3,510 | 3,412 | 3,480 | 3,508 | 3,302 | 3,456 | 3,347 | 3,432 |
| 2010 | 3,736 | 3,446 | 3,818 | 3,713 | 3,863 | 3,691 | 3,883 | 3,928 | 3,811 | 4,006 | 3,876 | 4,063 |
| 2011 | 3,022 | 2,676 | 3,099 | 3,035 | 3,143 | 3,025 | 3,146 | 3,183 | 3,075 | 3,279 | 3,213 | 3,304 |
| 2012 | 1,465 | 1,343 | 1,441 | 1,391 | 1,443 | 1,388 | 1,471 | 1,464 | 1,425 | 1,476 | 1,430 | 1,465 |
| 2013 | 1,458 | 1,321 | 1,458 | 1,429 | 1,472 | 1,422 | 1,499 | 1,495 | 1,443 | 1,496 | 1,463 | 1,486 |
| 2014 | 1,329 | 1,228 | 1,370 | 1,358 | 1,396 | 1,358 | 1,433 | 1,441 | 1,394 | 1,454 | 1,398 | 1,456 |
| 2015 | 1,238 | 1,124 | 1,249 | 1,227 | 1,249 | 1,206 | 1,250 | 1,252 | 1,219 | 1,250 | 1,205 | 1,245 |
| - = No Data Reported; -- = Not Applicable; NA = Not Available; W = Withheld to avoid disclosure of individual company data. |
| Release Date: 3/29/2024 |
| Next Release Date: 4/30/2024 |