|
Download Data (XLS File) |
|
|||||
|
|||||
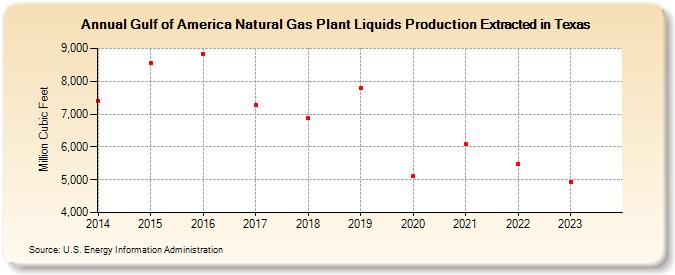
| Gulf Of Mexico Natural Gas Plant Liquids Production Extracted in Texas (Million Cubic Feet) | |||||
| Decade | Year-0 | Year-1 | Year-2 | Year-3 | Year-4 | Year-5 | Year-6 | Year-7 | Year-8 | Year-9 |
|---|---|---|---|---|---|---|---|---|---|---|
| 2010's | 7,404 | 8,540 | 8,844 | 7,277 | 6,875 | 7,803 | ||||
| 2020's | 5,119 | 6,091 | 5,490 |
| - = No Data Reported; -- = Not Applicable; NA = Not Available; W = Withheld to avoid disclosure of individual company data. |
| Release Date: 3/29/2024 |
| Next Release Date: 4/30/2024 |