|
Download Data (XLS File) |
|
||||||||
|
||||||||
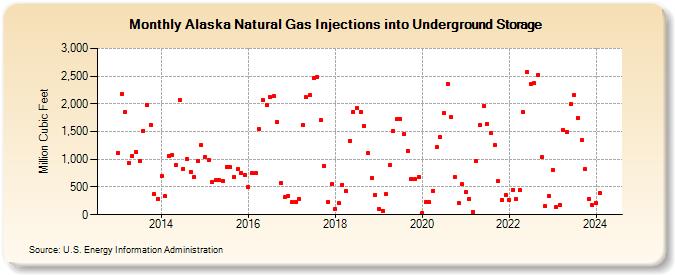
| Alaska Natural Gas Injections into Underground Storage (Million Cubic Feet) | ||||||||
| Year | Jan | Feb | Mar | Apr | May | Jun | Jul | Aug | Sep | Oct | Nov | Dec |
|---|---|---|---|---|---|---|---|---|---|---|---|---|
| 2013 | 1,120 | 2,185 | 1,860 | 933 | 1,065 | 1,131 | 977 | 1,518 | 1,981 | 1,627 | 367 | 291 |
| 2014 | 701 | 337 | 1,062 | 1,084 | 903 | 2,078 | 831 | 997 | 774 | 678 | 976 | 1,255 |
| 2015 | 1,039 | 982 | 589 | 621 | 618 | 611 | 865 | 857 | 682 | 824 | 756 | 717 |
| 2016 | 496 | 748 | 752 | 1,540 | 2,065 | 1,970 | 2,123 | 2,139 | 1,671 | 581 | 313 | 334 |
| 2017 | 222 | 236 | 292 | 1,611 | 2,116 | 2,154 | 2,462 | 2,487 | 1,707 | 879 | 238 | 550 |
| 2018 | 100 | 203 | 541 | 430 | 1,335 | 1,859 | 1,919 | 1,860 | 1,599 | 1,116 | 671 | 357 |
| 2019 | 102 | 76 | 366 | 893 | 1,506 | 1,719 | 1,721 | 1,449 | 1,150 | 650 | 637 | 684 |
| 2020 | 33 | 231 | 223 | 436 | 1,218 | 1,400 | 1,835 | 2,359 | 1,756 | 683 | 215 | 549 |
| 2021 | 415 | 285 | 51 | 974 | 1,612 | 1,969 | 1,636 | 1,470 | 1,256 | 601 | 267 | 349 |
| 2022 | 263 | 447 | 285 | 438 | 1,844 | 2,576 | 2,361 | 2,375 | 2,525 | 1,035 | 150 | 340 |
| 2023 | 812 | 134 | 180 | 1,522 | 1,498 | 1,991 | 2,159 | 1,753 | 1,339 | 822 | 284 | 168 |
| 2024 | 206 | |||||||||||
| - = No Data Reported; -- = Not Applicable; NA = Not Available; W = Withheld to avoid disclosure of individual company data. |
| Release Date: 3/29/2024 |
| Next Release Date: 4/30/2024 |