|
Download Data (XLS File) |
|
||||||||
|
||||||||
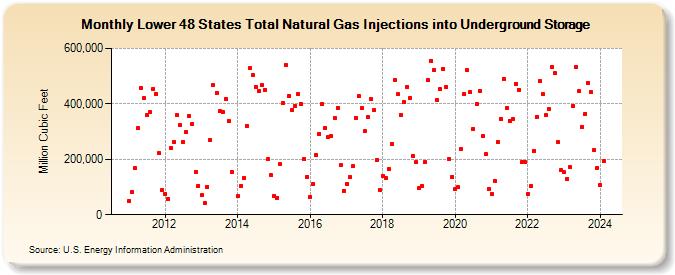
| Lower 48 States Total Natural Gas Injections into Underground Storage (Million Cubic Feet) | ||||||||
| Year | Jan | Feb | Mar | Apr | May | Jun | Jul | Aug | Sep | Oct | Nov | Dec |
|---|---|---|---|---|---|---|---|---|---|---|---|---|
| 2011 | 50,130 | 81,827 | 167,632 | 312,290 | 457,725 | 420,644 | 359,267 | 370,180 | 453,548 | 436,748 | 221,389 | 90,432 |
| 2012 | 74,854 | 56,243 | 240,351 | 263,896 | 357,965 | 323,026 | 263,910 | 299,798 | 357,109 | 327,767 | 155,554 | 104,953 |
| 2013 | 70,853 | 41,928 | 100,660 | 271,236 | 466,627 | 439,390 | 372,472 | 372,115 | 418,852 | 338,357 | 154,663 | |
| 2014 | 67,600 | 104,037 | 132,997 | 321,828 | 527,860 | 504,311 | 462,167 | 445,872 | 467,828 | 451,675 | 199,417 | 141,558 |
| 2015 | 68,874 | 60,790 | 181,491 | 404,317 | 540,254 | 429,403 | 377,941 | 393,299 | 434,712 | 400,055 | 200,533 | 137,510 |
| 2016 | 65,542 | 110,690 | 214,617 | 292,883 | 400,319 | 314,448 | 281,066 | 283,343 | 349,116 | 386,055 | 177,590 | 86,322 |
| 2017 | 112,283 | 136,795 | 174,588 | 350,688 | 428,237 | 383,419 | 300,918 | 350,900 | 417,604 | 377,301 | 198,787 | 90,160 |
| 2018 | 140,746 | 132,309 | 163,576 | 255,151 | 487,634 | 434,320 | 359,625 | 405,279 | 462,214 | 420,450 | 212,464 | 190,156 |
| 2019 | 95,040 | 104,276 | 189,323 | 484,705 | 555,410 | 521,353 | 413,873 | 451,803 | 527,360 | 460,769 | 200,540 | 137,113 |
| 2020 | 94,407 | 98,664 | 236,116 | 436,326 | 520,774 | 441,402 | 310,365 | 399,024 | 447,834 | 282,437 | 217,915 | 93,590 |
| 2021 | 75,409 | 122,071 | 262,105 | 346,398 | 490,067 | 385,698 | 339,336 | 344,291 | 472,176 | 451,188 | 188,406 | 189,904 |
| 2022 | 75,316 | 101,804 | 230,796 | 353,710 | 482,720 | 435,230 | 359,329 | 380,094 | 533,541 | 509,854 | 260,996 | 159,789 |
| 2023 | 152,335 | 130,098 | 170,776 | 393,458 | 532,478 | 446,263 | 317,425 | 363,607 | 476,745 | 441,114 | 232,848 | 170,208 |
| 2024 | 106,336 | |||||||||||
| - = No Data Reported; -- = Not Applicable; NA = Not Available; W = Withheld to avoid disclosure of individual company data. |
| Release Date: 3/29/2024 |
| Next Release Date: 4/30/2024 |