|
Download Data (XLS File) |
|
|||||
|
|||||
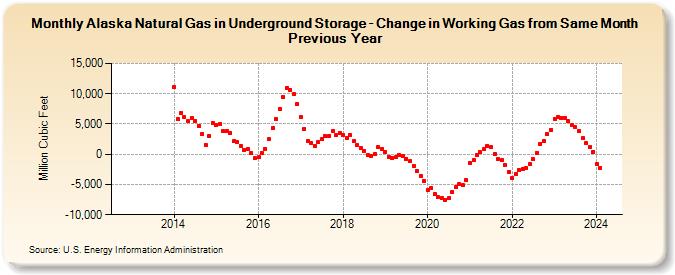
| Alaska Natural Gas in Underground Storage - Change in Working Gas from Same Month Previous Year (Million Cubic Feet) | |||||
| Year | Jan | Feb | Mar | Apr | May | Jun | Jul | Aug | Sep | Oct | Nov | Dec |
|---|---|---|---|---|---|---|---|---|---|---|---|---|
| 2013 | NA | NA | NA | NA | NA | NA | NA | NA | NA | NA | NA | NA |
| 2014 | 11,087 | 5,754 | 6,824 | 6,119 | 5,428 | 6,065 | 5,421 | 4,685 | 3,365 | 1,565 | 3,028 | 5,179 |
| 2015 | 4,768 | 4,958 | 3,824 | 3,761 | 3,574 | 2,105 | 2,020 | 1,381 | 723 | 881 | 189 | -679 |
| 2016 | -515 | 164 | 850 | 2,474 | 4,360 | 5,751 | 7,556 | 9,446 | 11,016 | 10,669 | 9,931 | 8,284 |
| 2017 | 6,094 | 4,191 | 2,168 | 1,803 | 1,370 | 2,010 | 2,457 | 2,937 | 3,083 | 3,855 | 3,105 | 3,585 |
| 2018 | 3,239 | 2,660 | 3,212 | 2,112 | 1,443 | 1,085 | 523 | -158 | -246 | 20 | 1,132 | 889 |
| 2019 | 361 | -408 | -664 | -496 | -133 | -357 | -711 | -1,186 | -1,880 | -2,799 | -3,561 | -4,449 |
| 2020 | -5,859 | -5,517 | -6,553 | -7,119 | -7,289 | -7,489 | -7,245 | -6,233 | -5,343 | -4,946 | -5,168 | -4,330 |
| 2021 | -1,444 | -957 | -136 | 288 | 789 | 1,387 | 1,157 | 59 | -836 | -1,005 | -1,859 | -2,872 |
| 2022 | -3,871 | -3,350 | -2,637 | -2,416 | -2,267 | -1,638 | -839 | 256 | 1,737 | 2,160 | 3,337 | 4,085 |
| 2023 | 5,837 | 6,084 | 6,069 | 6,045 | 5,462 | 4,786 | 4,438 | 3,868 | 2,635 | 1,846 | 1,214 | 432 |
| 2024 | -1,592 | -2,242 | ||||||||||
| - = No Data Reported; -- = Not Applicable; NA = Not Available; W = Withheld to avoid disclosure of individual company data. |
| Release Date: 4/30/2024 |
| Next Release Date: 5/31/2024 |