|
Download Data (XLS File) |
|
|||||
|
|||||
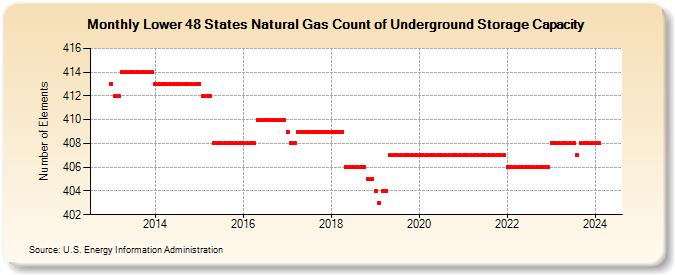
| Lower 48 States Natural Gas Count of Underground Storage Capacity (Number of Elements) | |||||
| Year | Jan | Feb | Mar | Apr | May | Jun | Jul | Aug | Sep | Oct | Nov | Dec |
|---|---|---|---|---|---|---|---|---|---|---|---|---|
| 2013 | 413 | 412 | 412 | 414 | 414 | 414 | 414 | 414 | 414 | 414 | 414 | 414 |
| 2014 | 413 | 413 | 413 | 413 | 413 | 413 | 413 | 413 | 413 | 413 | 413 | 413 |
| 2015 | 413 | 412 | 412 | 412 | 408 | 408 | 408 | 408 | 408 | 408 | 408 | 408 |
| 2016 | 408 | 408 | 408 | 408 | 410 | 410 | 410 | 410 | 410 | 410 | 410 | 410 |
| 2017 | 409 | 408 | 408 | 409 | 409 | 409 | 409 | 409 | 409 | 409 | 409 | 409 |
| 2018 | 409 | 409 | 409 | 409 | 406 | 406 | 406 | 406 | 406 | 406 | 405 | 405 |
| 2019 | 404 | 403 | 404 | 404 | 407 | 407 | 407 | 407 | 407 | 407 | 407 | 407 |
| 2020 | 407 | 407 | 407 | 407 | 407 | 407 | 407 | 407 | 407 | 407 | 407 | 407 |
| 2021 | 407 | 407 | 407 | 407 | 407 | 407 | 407 | 407 | 407 | 407 | 407 | 407 |
| 2022 | 406 | 406 | 406 | 406 | 406 | 406 | 406 | 406 | 406 | 406 | 406 | 406 |
| 2023 | 408 | 408 | 408 | 408 | 408 | 408 | 408 | 407 | 408 | 408 | 408 | 408 |
| 2024 | 408 | |||||||||||
| - = No Data Reported; -- = Not Applicable; NA = Not Available; W = Withheld to avoid disclosure of individual company data. |
| Release Date: 3/29/2024 |
| Next Release Date: 4/30/2024 |