|
Download Data (XLS File) |
|
|||||
|
|||||
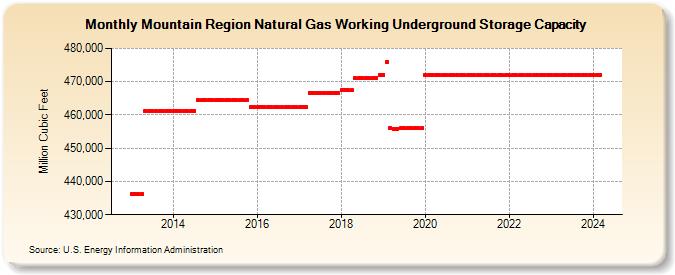
| Mountain Region Natural Gas Working Underground Storage Capacity (Million Cubic Feet) | |||||
| Year | Jan | Feb | Mar | Apr | May | Jun | Jul | Aug | Sep | Oct | Nov | Dec |
|---|---|---|---|---|---|---|---|---|---|---|---|---|
| 2013 | 436,243 | 436,243 | 436,243 | 436,243 | 461,243 | 461,243 | 461,243 | 461,243 | 461,243 | 461,243 | 461,243 | 461,243 |
| 2014 | 461,243 | 461,243 | 461,243 | 461,243 | 461,243 | 461,243 | 461,243 | 464,435 | 464,435 | 464,435 | 464,435 | 464,435 |
| 2015 | 464,435 | 464,435 | 464,435 | 464,435 | 464,479 | 464,479 | 464,479 | 464,479 | 464,479 | 464,479 | 462,313 | 462,313 |
| 2016 | 462,313 | 462,313 | 462,313 | 462,313 | 462,313 | 462,313 | 462,313 | 462,313 | 462,313 | 462,313 | 462,313 | 462,313 |
| 2017 | 462,289 | 462,289 | 462,289 | 466,689 | 466,689 | 466,689 | 466,689 | 466,689 | 466,689 | 466,689 | 466,689 | 466,689 |
| 2018 | 467,475 | 467,475 | 467,475 | 467,475 | 471,075 | 471,075 | 471,075 | 471,075 | 471,075 | 471,092 | 471,140 | 471,969 |
| 2019 | 472,017 | 476,058 | 456,105 | 455,856 | 455,856 | 456,056 | 456,056 | 456,056 | 456,056 | 456,056 | 456,056 | 456,056 |
| 2020 | 472,056 | 472,056 | 472,056 | 472,056 | 472,056 | 472,056 | 472,056 | 472,056 | 472,056 | 472,056 | 472,056 | 471,861 |
| 2021 | 471,861 | 471,861 | 471,861 | 471,861 | 471,861 | 471,861 | 471,861 | 471,861 | 471,861 | 471,861 | 471,861 | 471,861 |
| 2022 | 471,861 | 471,861 | 471,861 | 471,861 | 471,861 | 471,861 | 471,861 | 471,861 | 472,040 | 472,040 | 472,066 | 472,066 |
| 2023 | 472,066 | 472,066 | 472,066 | 472,066 | 472,066 | 472,066 | 472,066 | 472,066 | 472,066 | 472,066 | 472,066 | 472,066 |
| 2024 | 472,066 | 472,066 | ||||||||||
| - = No Data Reported; -- = Not Applicable; NA = Not Available; W = Withheld to avoid disclosure of individual company data. |
| Release Date: 4/30/2024 |
| Next Release Date: 5/31/2024 |