|
Download Data (XLS File) |
|
||||||||
|
||||||||
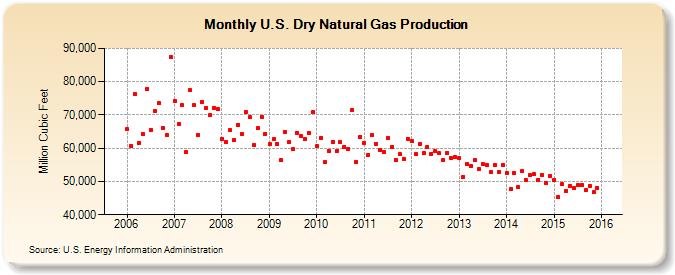
| U.S. Dry Natural Gas Production (Million Cubic Feet) | ||||||||
| Year | Jan | Feb | Mar | Apr | May | Jun | Jul | Aug | Sep | Oct | Nov | Dec |
|---|---|---|---|---|---|---|---|---|---|---|---|---|
| 2006 | 65,656 | 60,727 | 76,302 | 61,682 | 64,287 | 77,777 | 65,574 | 71,029 | 73,524 | 66,094 | 63,914 | 87,471 |
| 2007 | 74,110 | 67,403 | 72,850 | 58,881 | 77,365 | 72,897 | 63,995 | 74,019 | 72,125 | 69,854 | 72,113 | 71,815 |
| 2008 | 62,840 | 61,856 | 65,485 | 62,439 | 67,093 | 64,352 | 70,984 | 69,228 | 60,976 | 66,020 | 69,522 | 64,387 |
| 2009 | 61,231 | 62,626 | 61,342 | 56,360 | 64,967 | 61,824 | 59,656 | 64,642 | 63,550 | 62,669 | 64,664 | 70,780 |
| 2010 | 60,521 | 63,064 | 55,722 | 59,287 | 61,857 | 59,089 | 61,759 | 60,499 | 59,718 | 71,485 | 55,979 | 63,481 |
| 2011 | 61,671 | 57,967 | 63,950 | 61,342 | 59,434 | 58,963 | 62,998 | 60,375 | 56,552 | 58,189 | 56,757 | 62,820 |
| 2012 | 62,136 | 58,136 | 61,256 | 58,461 | 60,420 | 58,349 | 59,043 | 58,458 | 56,380 | 58,635 | 56,956 | 57,276 |
| 2013 | 57,105 | 51,342 | 55,160 | 54,691 | 56,353 | 53,648 | 55,166 | 54,906 | 52,763 | 55,014 | 52,950 | 54,823 |
| 2014 | 52,571 | 47,701 | 52,516 | 48,293 | 53,007 | 50,306 | 51,920 | 52,147 | 50,539 | 52,064 | 49,453 | 51,722 |
| 2015 | 50,327 | 45,304 | 49,156 | 47,253 | 48,734 | 48,061 | 48,963 | 48,982 | 47,304 | 48,741 | 46,688 | 48,147 |
| - = No Data Reported; -- = Not Applicable; NA = Not Available; W = Withheld to avoid disclosure of individual company data. |
| Release Date: 8/30/2024 |
| Next Release Date: 9/30/2024 |