|
Download Data (XLS File) |
|
|||||
|
|||||
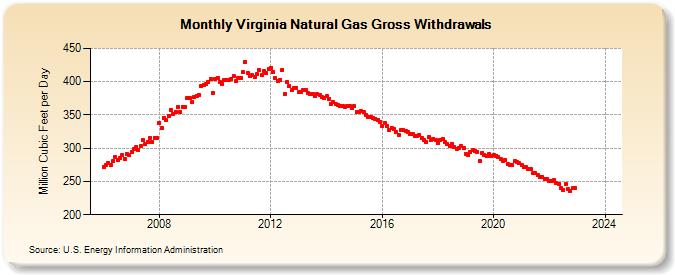
| Virginia Natural Gas Gross Withdrawals (Million Cubic Feet per Day) | |||||
| Year | Jan | Feb | Mar | Apr | May | Jun | Jul | Aug | Sep | Oct | Nov | Dec |
|---|---|---|---|---|---|---|---|---|---|---|---|---|
| 2006 | 271 | 275 | 277 | 274 | 280 | 287 | 282 | 285 | 290 | 284 | 291 | 290 |
| 2007 | 295 | 299 | 302 | 298 | 304 | 312 | 307 | 310 | 316 | 309 | 316 | 316 |
| 2008 | 338 | 331 | 346 | 342 | 349 | 358 | 352 | 355 | 362 | 354 | 362 | 362 |
| 2009 | 375 | 376 | 369 | 377 | 379 | 380 | 394 | 395 | 396 | 400 | 404 | 383 |
| 2010 | 404 | 406 | 400 | 397 | 403 | 403 | 403 | 404 | 408 | 401 | 406 | 406 |
| 2011 | 414 | 430 | 413 | 409 | 410 | 407 | 411 | 418 | 410 | 416 | 413 | 419 |
| 2012 | 421 | 414 | 405 | 401 | 403 | 418 | 381 | 399 | 393 | 387 | 390 | 391 |
| 2013 | 384 | 385 | 388 | 388 | 383 | 382 | 381 | 378 | 381 | 380 | 377 | 375 |
| 2014 | 378 | 374 | 367 | 369 | 366 | 365 | 364 | 363 | 362 | 363 | 363 | 361 |
| 2015 | 363 | 354 | 354 | 356 | 354 | 350 | 347 | 347 | 345 | 344 | 343 | 340 |
| 2016 | 334 | 338 | 334 | 328 | 331 | 329 | 324 | 320 | 327 | 328 | 326 | 324 |
| 2017 | 322 | 322 | 319 | 318 | 320 | 316 | 313 | 310 | 317 | 312 | 314 | 312 |
| 2018 | 308 | 313 | 314 | 309 | 307 | 304 | 307 | 302 | 299 | 300 | 303 | 300 |
| 2019 | 292 | 290 | 294 | 297 | 296 | 295 | 281 | 293 | 290 | 288 | 291 | 289 |
| 2020 | 290 | 289 | 286 | 283 | 281 | 282 | 276 | 274 | 275 | 280 | 279 | 277 |
| 2021 | 274 | 272 | 271 | 269 | 269 | 262 | 262 | 259 | 256 | 257 | 254 | 253 |
| 2022 | 251 | 251 | 252 | 248 | 246 | 240 | 237 | 246 | 238 | 236 | 240 | 240 |
| 2023 | NA | NA | NA | NA | NA | NA | NA | NA | NA | NA | NA | NA |
| 2024 | NA | NA | ||||||||||
| - = No Data Reported; -- = Not Applicable; NA = Not Available; W = Withheld to avoid disclosure of individual company data. |
| Release Date: 4/30/2024 |
| Next Release Date: 5/31/2024 |