|
Download Data (XLS File) |
|
|||||
|
|||||
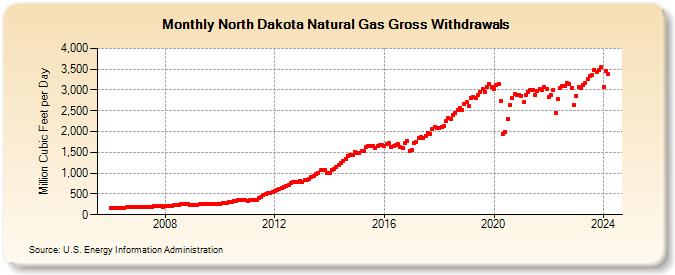
| North Dakota Natural Gas Gross Withdrawals (Million Cubic Feet per Day) | |||||
| Year | Jan | Feb | Mar | Apr | May | Jun | Jul | Aug | Sep | Oct | Nov | Dec |
|---|---|---|---|---|---|---|---|---|---|---|---|---|
| 2006 | 158 | 155 | 160 | 165 | 167 | 169 | 170 | 174 | 182 | 186 | 185 | 190 |
| 2007 | 187 | 188 | 185 | 189 | 191 | 194 | 196 | 204 | 202 | 203 | 207 | 182 |
| 2008 | 209 | 207 | 215 | 221 | 232 | 243 | 243 | 249 | 260 | 267 | 269 | 242 |
| 2009 | 241 | 243 | 245 | 250 | 247 | 249 | 258 | 263 | 260 | 255 | 267 | 262 |
| 2010 | 252 | 272 | 279 | 282 | 302 | 305 | 324 | 331 | 343 | 348 | 360 | 343 |
| 2011 | 340 | 342 | 360 | 359 | 364 | 397 | 434 | 466 | 492 | 515 | 534 | 552 |
| 2012 | 572 | 587 | 620 | 641 | 678 | 701 | 719 | 762 | 797 | 798 | 781 | 817 |
| 2013 | 792 | 835 | 846 | 861 | 900 | 933 | 972 | 1,008 | 1,066 | 1,072 | 1,085 | 992 |
| 2014 | 1,015 | 1,064 | 1,090 | 1,139 | 1,195 | 1,254 | 1,294 | 1,349 | 1,423 | 1,437 | 1,438 | 1,516 |
| 2015 | 1,476 | 1,480 | 1,527 | 1,534 | 1,625 | 1,655 | 1,658 | 1,644 | 1,604 | 1,657 | 1,678 | 1,673 |
| 2016 | 1,642 | 1,691 | 1,713 | 1,630 | 1,645 | 1,665 | 1,699 | 1,640 | 1,614 | 1,721 | 1,763 | 1,541 |
| 2017 | 1,564 | 1,718 | 1,739 | 1,840 | 1,858 | 1,856 | 1,901 | 1,955 | 1,947 | 2,066 | 2,099 | 2,087 |
| 2018 | 2,077 | 2,107 | 2,122 | 2,243 | 2,315 | 2,300 | 2,403 | 2,442 | 2,527 | 2,569 | 2,524 | 2,653 |
| 2019 | 2,700 | 2,612 | 2,803 | 2,827 | 2,816 | 2,887 | 2,947 | 3,016 | 2,951 | 3,082 | 3,145 | 3,078 |
| 2020 | 3,022 | 3,114 | 3,141 | 2,730 | 1,938 | 1,984 | 2,313 | 2,646 | 2,814 | 2,892 | 2,891 | 2,891 |
| 2021 | 2,852 | 2,708 | 2,869 | 2,953 | 2,992 | 2,995 | 2,881 | 2,965 | 3,022 | 2,999 | 3,080 | 3,031 |
| 2022 | 2,841 | 2,875 | 3,011 | 2,454 | 2,789 | 3,059 | 3,103 | 3,084 | 3,177 | 3,154 | 3,037 | 2,642 |
| 2023 | 2,861 | 3,068 | 3,045 | 3,122 | 3,168 | 3,266 | 3,325 | 3,350 | 3,483 | 3,438 | 3,486 | 3,551 |
| 2024 | 3,076 | 3,452 | ||||||||||
| - = No Data Reported; -- = Not Applicable; NA = Not Available; W = Withheld to avoid disclosure of individual company data. |
| Release Date: 4/30/2024 |
| Next Release Date: 5/31/2024 |