|
Download Data (XLS File) |
|
|||||
|
|||||
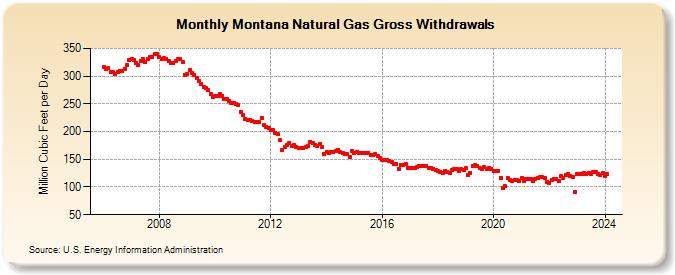
| Montana Natural Gas Gross Withdrawals (Million Cubic Feet per Day) | |||||
| Year | Jan | Feb | Mar | Apr | May | Jun | Jul | Aug | Sep | Oct | Nov | Dec |
|---|---|---|---|---|---|---|---|---|---|---|---|---|
| 2006 | 317 | 313 | 314 | 307 | 308 | 303 | 307 | 309 | 309 | 312 | 320 | 329 |
| 2007 | 330 | 329 | 324 | 320 | 328 | 330 | 325 | 331 | 335 | 334 | 340 | 339 |
| 2008 | 334 | 330 | 332 | 331 | 327 | 323 | 324 | 327 | 330 | 330 | 326 | 302 |
| 2009 | 304 | 311 | 305 | 302 | 297 | 292 | 286 | 281 | 279 | 275 | 268 | 263 |
| 2010 | 265 | 264 | 267 | 265 | 259 | 258 | 256 | 251 | 251 | 249 | 247 | 236 |
| 2011 | 229 | 223 | 221 | 221 | 219 | 217 | 218 | 217 | 225 | 211 | 208 | 206 |
| 2012 | 202 | 202 | 198 | 195 | 184 | 167 | 172 | 176 | 179 | 174 | 176 | 172 |
| 2013 | 170 | 170 | 171 | 172 | 174 | 182 | 179 | 176 | 174 | 178 | 172 | 160 |
| 2014 | 164 | 162 | 163 | 164 | 165 | 166 | 163 | 162 | 159 | 159 | 155 | 165 |
| 2015 | 162 | 163 | 162 | 162 | 162 | 161 | 162 | 158 | 157 | 159 | 156 | 152 |
| 2016 | 149 | 149 | 148 | 147 | 145 | 142 | 141 | 133 | 139 | 140 | 142 | 135 |
| 2017 | 134 | 135 | 135 | 136 | 138 | 138 | 138 | 138 | 135 | 134 | 133 | 131 |
| 2018 | 129 | 127 | 126 | 129 | 127 | 126 | 130 | 132 | 132 | 128 | 132 | 130 |
| 2019 | 134 | 122 | 126 | 137 | 139 | 138 | 134 | 133 | 136 | 132 | 135 | 133 |
| 2020 | 129 | 128 | 129 | 117 | 98 | 101 | 116 | 113 | 111 | 113 | 113 | 111 |
| 2021 | 116 | 111 | 115 | 115 | 115 | 110 | 115 | 117 | 118 | 118 | 116 | 109 |
| 2022 | 108 | 112 | 115 | 114 | 111 | 119 | 117 | 122 | 123 | 120 | 118 | 91 |
| 2023 | 123 | 124 | 124 | 125 | 124 | 125 | 123 | 127 | 127 | 124 | 121 | 126 |
| 2024 | 120 | 123 | ||||||||||
| - = No Data Reported; -- = Not Applicable; NA = Not Available; W = Withheld to avoid disclosure of individual company data. |
| Release Date: 4/30/2024 |
| Next Release Date: 5/31/2024 |