|
Download Data (XLS File) |
|
|||||
|
|||||
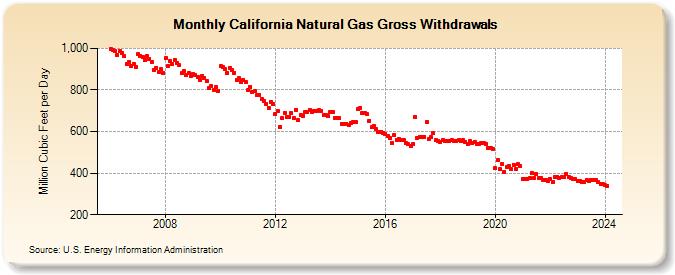
| California Natural Gas Gross Withdrawals (Million Cubic Feet per Day) | |||||
| Year | Jan | Feb | Mar | Apr | May | Jun | Jul | Aug | Sep | Oct | Nov | Dec |
|---|---|---|---|---|---|---|---|---|---|---|---|---|
| 2006 | 998 | 992 | 986 | 967 | 989 | 976 | 962 | 924 | 934 | 917 | 927 | 909 |
| 2007 | 971 | 965 | 958 | 942 | 963 | 950 | 936 | 898 | 907 | 887 | 899 | 883 |
| 2008 | 953 | 914 | 940 | 925 | 945 | 932 | 919 | 881 | 890 | 870 | 882 | 866 |
| 2009 | 876 | 871 | 864 | 850 | 869 | 857 | 845 | 810 | 819 | 801 | 812 | 797 |
| 2010 | 915 | 909 | 901 | 883 | 906 | 895 | 883 | 848 | 857 | 839 | 849 | 836 |
| 2011 | 798 | 816 | 790 | 796 | 776 | 776 | 757 | 748 | 734 | 714 | 744 | 732 |
| 2012 | 685 | 697 | 623 | 663 | 691 | 671 | 670 | 687 | 666 | 705 | 655 | 679 |
| 2013 | 676 | 693 | 696 | 703 | 692 | 697 | 701 | 703 | 700 | 680 | 682 | 673 |
| 2014 | 696 | 694 | 667 | 667 | 663 | 638 | 636 | 638 | 631 | 640 | 646 | 645 |
| 2015 | 707 | 715 | 687 | 687 | 684 | 652 | 620 | 628 | 613 | 598 | 600 | 595 |
| 2016 | 588 | 580 | 571 | 545 | 584 | 560 | 563 | 559 | 558 | 545 | 540 | 530 |
| 2017 | 538 | 670 | 571 | 576 | 574 | 574 | 645 | 566 | 572 | 591 | 559 | 556 |
| 2018 | 552 | 559 | 555 | 553 | 556 | 557 | 556 | 554 | 557 | 554 | 557 | 552 |
| 2019 | 542 | 554 | 546 | 552 | 540 | 542 | 545 | 547 | 542 | 523 | 522 | 517 |
| 2020 | 423 | 463 | 418 | 443 | 406 | 428 | 435 | 418 | 441 | 418 | 442 | 433 |
| 2021 | 374 | 374 | 373 | 375 | 401 | 378 | 395 | 375 | 377 | 368 | 368 | 361 |
| 2022 | 370 | 355 | 379 | 383 | 378 | 381 | 383 | 397 | 380 | 377 | 374 | 372 |
| 2023 | 361 | 363 | 356 | 359 | 367 | 364 | 366 | 366 | 365 | 356 | 346 | 347 |
| 2024 | 342 | |||||||||||
| - = No Data Reported; -- = Not Applicable; NA = Not Available; W = Withheld to avoid disclosure of individual company data. |
| Release Date: 3/29/2024 |
| Next Release Date: 4/30/2024 |