|
Download Data (XLS File) |
|
|||||
|
|||||
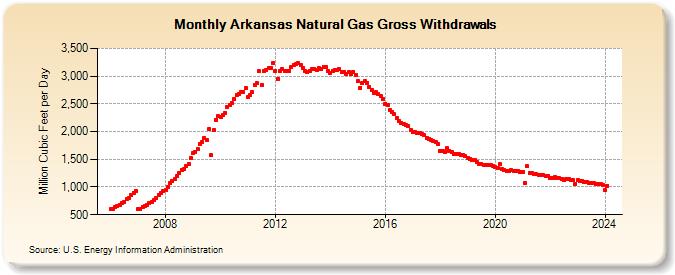
| Arkansas Natural Gas Gross Withdrawals (Million Cubic Feet per Day) | |||||
| Year | Jan | Feb | Mar | Apr | May | Jun | Jul | Aug | Sep | Oct | Nov | Dec |
|---|---|---|---|---|---|---|---|---|---|---|---|---|
| 2006 | 600 | 607 | 639 | 654 | 681 | 718 | 732 | 775 | 808 | 856 | 899 | 923 |
| 2007 | 596 | 603 | 636 | 651 | 680 | 717 | 731 | 774 | 810 | 861 | 899 | 923 |
| 2008 | 940 | 1,005 | 1,065 | 1,104 | 1,142 | 1,196 | 1,256 | 1,313 | 1,316 | 1,375 | 1,422 | 1,517 |
| 2009 | 1,605 | 1,627 | 1,679 | 1,774 | 1,816 | 1,877 | 1,839 | 2,047 | 1,571 | 2,028 | 2,217 | 2,273 |
| 2010 | 2,263 | 2,295 | 2,340 | 2,450 | 2,471 | 2,517 | 2,582 | 2,660 | 2,686 | 2,706 | 2,716 | 2,789 |
| 2011 | 2,627 | 2,664 | 2,717 | 2,845 | 2,868 | 3,088 | 2,837 | 3,088 | 3,118 | 3,141 | 3,153 | 3,238 |
| 2012 | 3,091 | 2,953 | 3,091 | 3,125 | 3,094 | 3,097 | 3,089 | 3,173 | 3,202 | 3,212 | 3,235 | 3,209 |
| 2013 | 3,153 | 3,090 | 3,072 | 3,098 | 3,125 | 3,122 | 3,112 | 3,138 | 3,122 | 3,172 | 3,172 | 3,090 |
| 2014 | 3,060 | 3,099 | 3,114 | 3,113 | 3,121 | 3,067 | 3,080 | 3,045 | 3,070 | 3,046 | 3,083 | 3,019 |
| 2015 | 2,907 | 2,794 | 2,868 | 2,909 | 2,884 | 2,804 | 2,751 | 2,700 | 2,708 | 2,677 | 2,633 | 2,586 |
| 2016 | 2,503 | 2,471 | 2,395 | 2,350 | 2,308 | 2,236 | 2,194 | 2,160 | 2,133 | 2,120 | 2,094 | 2,035 |
| 2017 | 1,987 | 1,996 | 1,977 | 1,978 | 1,954 | 1,932 | 1,885 | 1,871 | 1,848 | 1,833 | 1,811 | 1,774 |
| 2018 | 1,655 | 1,650 | 1,631 | 1,695 | 1,646 | 1,627 | 1,594 | 1,599 | 1,588 | 1,585 | 1,575 | 1,555 |
| 2019 | 1,530 | 1,508 | 1,491 | 1,482 | 1,449 | 1,423 | 1,415 | 1,403 | 1,393 | 1,390 | 1,391 | 1,382 |
| 2020 | 1,361 | 1,349 | 1,409 | 1,326 | 1,306 | 1,292 | 1,286 | 1,301 | 1,292 | 1,297 | 1,286 | 1,273 |
| 2021 | 1,267 | 1,078 | 1,370 | 1,259 | 1,244 | 1,231 | 1,227 | 1,218 | 1,218 | 1,214 | 1,203 | 1,194 |
| 2022 | 1,164 | 1,155 | 1,172 | 1,168 | 1,154 | 1,143 | 1,132 | 1,142 | 1,140 | 1,133 | 1,119 | 1,063 |
| 2023 | 1,122 | 1,110 | 1,111 | 1,097 | 1,087 | 1,076 | 1,068 | 1,064 | 1,062 | 1,052 | 1,046 | 1,035 |
| 2024 | 940 | 1,023 | ||||||||||
| - = No Data Reported; -- = Not Applicable; NA = Not Available; W = Withheld to avoid disclosure of individual company data. |
| Release Date: 4/30/2024 |
| Next Release Date: 5/31/2024 |