|
Download Data (XLS File) |
|
|||||
|
|||||
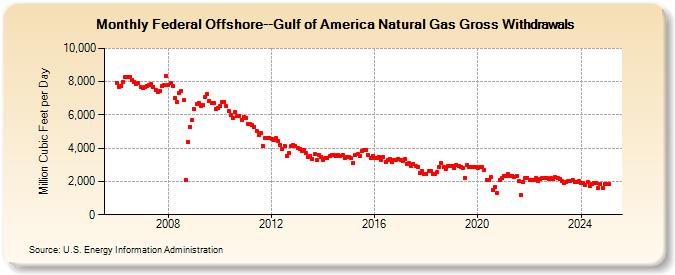
| Federal Offshore--Gulf of Mexico Natural Gas Gross Withdrawals (Million Cubic Feet per Day) | |||||
| Year | Jan | Feb | Mar | Apr | May | Jun | Jul | Aug | Sep | Oct | Nov | Dec |
|---|---|---|---|---|---|---|---|---|---|---|---|---|
| 2006 | 7,927 | 7,675 | 7,768 | 7,985 | 8,290 | 8,296 | 8,302 | 8,121 | 7,992 | 7,849 | 7,894 | 7,685 |
| 2007 | 7,628 | 7,682 | 7,741 | 7,786 | 7,857 | 7,672 | 7,490 | 7,395 | 7,410 | 7,720 | 7,778 | 8,322 |
| 2008 | 7,815 | 7,916 | 7,757 | 7,010 | 6,762 | 7,339 | 7,468 | 6,868 | 2,100 | 4,368 | 5,297 | 5,672 |
| 2009 | 6,351 | 6,635 | 6,726 | 6,550 | 6,606 | 7,088 | 7,272 | 6,858 | 6,728 | 6,728 | 6,377 | 6,427 |
| 2010 | 6,561 | 6,749 | 6,788 | 6,507 | 6,256 | 5,988 | 5,817 | 6,165 | 5,943 | 5,954 | 5,724 | 5,857 |
| 2011 | 5,815 | 5,482 | 5,478 | 5,407 | 5,292 | 5,029 | 4,802 | 4,890 | 4,160 | 4,616 | 4,614 | 4,628 |
| 2012 | 4,558 | 4,502 | 4,606 | 4,458 | 4,216 | 3,934 | 4,134 | 3,560 | 3,705 | 4,104 | 4,188 | 4,137 |
| 2013 | 4,012 | 3,921 | 3,810 | 3,862 | 3,693 | 3,476 | 3,549 | 3,357 | 3,624 | 3,294 | 3,603 | 3,446 |
| 2014 | 3,300 | 3,414 | 3,401 | 3,545 | 3,596 | 3,580 | 3,547 | 3,575 | 3,551 | 3,572 | 3,393 | 3,463 |
| 2015 | 3,474 | 3,406 | 3,126 | 3,613 | 3,638 | 3,558 | 3,809 | 3,887 | 3,913 | 3,616 | 3,413 | 3,526 |
| 2016 | 3,423 | 3,389 | 3,496 | 3,298 | 3,479 | 3,172 | 3,264 | 3,336 | 3,176 | 3,295 | 3,311 | 3,372 |
| 2017 | 3,317 | 3,219 | 3,325 | 3,075 | 3,115 | 2,946 | 3,073 | 2,910 | 2,865 | 2,526 | 2,643 | 2,452 |
| 2018 | 2,460 | 2,601 | 2,641 | 2,461 | 2,466 | 2,575 | 2,897 | 3,083 | 2,881 | 2,721 | 2,937 | 2,901 |
| 2019 | 2,955 | 2,787 | 3,017 | 2,953 | 2,886 | 2,785 | 2,211 | 2,989 | 2,854 | 2,847 | 2,839 | 2,871 |
| 2020 | 2,831 | 2,845 | 2,879 | 2,718 | 2,112 | 2,115 | 2,253 | 1,468 | 1,678 | 1,298 | 2,061 | 2,213 |
| 2021 | 2,352 | 2,330 | 2,425 | 2,357 | 2,356 | 2,280 | 2,350 | 2,009 | 1,178 | 1,961 | 2,217 | 2,223 |
| 2022 | 2,110 | 2,065 | 2,111 | 2,210 | 2,032 | 2,171 | 2,176 | 2,229 | 2,203 | 2,174 | 2,183 | 2,126 |
| 2023 | 2,223 | 2,164 | 2,131 | 1,984 | 1,849 | 1,938 | 2,071 | 1,971 | 2,132 | 2,027 | 1,936 | 1,942 |
| 2024 | 1,932 | 1,918 | ||||||||||
| - = No Data Reported; -- = Not Applicable; NA = Not Available; W = Withheld to avoid disclosure of individual company data. |
| Release Date: 4/30/2024 |
| Next Release Date: 5/31/2024 |