|
Download Data (XLS File) |
|
||||||||
|
||||||||
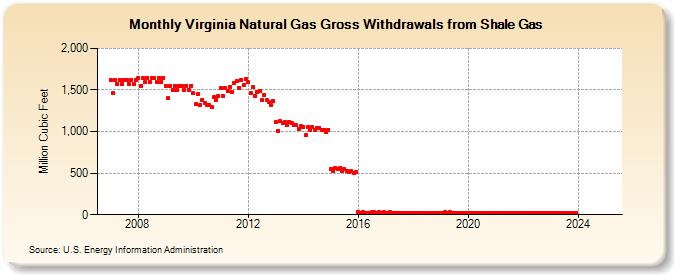
| Virginia Natural Gas Gross Withdrawals from Shale Gas (Million Cubic Feet) | ||||||||
| Year | Jan | Feb | Mar | Apr | May | Jun | Jul | Aug | Sep | Oct | Nov | Dec |
|---|---|---|---|---|---|---|---|---|---|---|---|---|
| 2007 | 1,622 | 1,465 | 1,622 | 1,570 | 1,622 | 1,570 | 1,622 | 1,622 | 1,570 | 1,622 | 1,570 | 1,622 |
| 2008 | 1,649 | 1,543 | 1,649 | 1,596 | 1,649 | 1,596 | 1,649 | 1,649 | 1,596 | 1,649 | 1,596 | 1,649 |
| 2009 | 1,553 | 1,403 | 1,553 | 1,503 | 1,553 | 1,503 | 1,553 | 1,553 | 1,503 | 1,553 | 1,503 | 1,553 |
| 2010 | 1,462 | 1,327 | 1,448 | 1,318 | 1,384 | 1,340 | 1,318 | 1,321 | 1,290 | 1,410 | 1,384 | 1,430 |
| 2011 | 1,528 | 1,431 | 1,522 | 1,482 | 1,534 | 1,476 | 1,579 | 1,604 | 1,525 | 1,625 | 1,560 | 1,636 |
| 2012 | 1,593 | 1,465 | 1,531 | 1,427 | 1,481 | 1,489 | 1,377 | 1,442 | 1,374 | 1,350 | 1,316 | 1,366 |
| 2013 | 1,118 | 1,012 | 1,129 | 1,098 | 1,119 | 1,081 | 1,113 | 1,102 | 1,077 | 1,075 | 1,031 | 1,061 |
| 2014 | 1,056 | 954 | 1,056 | 1,023 | 1,057 | 1,023 | 1,047 | 1,047 | 1,013 | 1,022 | 989 | 1,022 |
| 2015 | 555 | 521 | 564 | 549 | 564 | 528 | 546 | 530 | 516 | 524 | 498 | 511 |
| 2016 | 30 | 26 | 27 | 26 | 26 | 26 | 27 | 27 | 26 | 27 | 26 | 27 |
| 2017 | 26 | 24 | 27 | 25 | 26 | 25 | 26 | 26 | 25 | 26 | 25 | 25 |
| 2018 | 25 | 22 | 24 | 23 | 24 | 24 | 25 | 25 | 23 | 24 | 22 | 21 |
| 2019 | 26 | 24 | 27 | 25 | 27 | 26 | 25 | 26 | 25 | 26 | 25 | 26 |
| 2020 | 26 | 24 | 26 | 25 | 26 | 25 | 26 | 25 | 24 | 24 | 23 | 25 |
| 2021 | 25 | 22 | 25 | 24 | 25 | 23 | 25 | 24 | 24 | 25 | 23 | 24 |
| 2022 | 24 | 22 | 23 | 23 | 24 | 22 | 23 | 24 | 22 | 23 | 22 | 23 |
| 2023 | NA | NA | NA | NA | NA | NA | NA | NA | NA | NA | NA | NA |
| 2024 | NA | |||||||||||
| - = No Data Reported; -- = Not Applicable; NA = Not Available; W = Withheld to avoid disclosure of individual company data. |
| Release Date: 3/29/2024 |
| Next Release Date: 4/30/2024 |