|
Download Data (XLS File) |
|
||||||||
|
||||||||
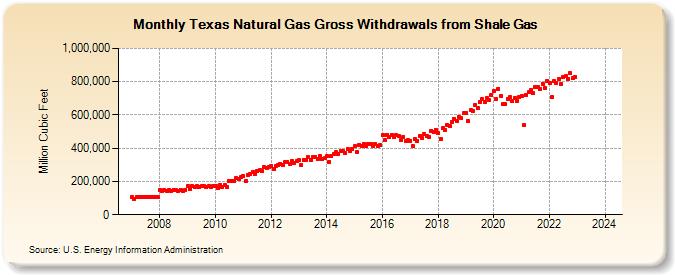
| Texas Natural Gas Gross Withdrawals from Shale Gas (Million Cubic Feet) | ||||||||
| Year | Jan | Feb | Mar | Apr | May | Jun | Jul | Aug | Sep | Oct | Nov | Dec |
|---|---|---|---|---|---|---|---|---|---|---|---|---|
| 2007 | 107,415 | 97,020 | 107,415 | 103,950 | 107,415 | 103,950 | 107,415 | 107,415 | 103,950 | 107,415 | 103,950 | 107,415 |
| 2008 | 149,885 | 140,215 | 149,885 | 145,050 | 149,885 | 145,050 | 149,885 | 149,885 | 145,050 | 149,885 | 145,050 | 149,885 |
| 2009 | 171,430 | 154,840 | 171,430 | 165,900 | 171,430 | 165,900 | 171,430 | 171,430 | 165,900 | 171,430 | 165,900 | 171,430 |
| 2010 | 174,342 | 160,128 | 180,419 | 168,880 | 177,313 | 169,232 | 203,930 | 205,113 | 200,365 | 220,938 | 217,327 | 224,963 |
| 2011 | 233,045 | 201,629 | 239,067 | 245,578 | 257,399 | 245,862 | 265,780 | 266,351 | 261,369 | 285,676 | 278,561 | 286,118 |
| 2012 | 295,702 | 275,546 | 294,723 | 296,798 | 306,742 | 296,355 | 314,822 | 317,692 | 307,513 | 324,068 | 312,815 | 320,158 |
| 2013 | 326,687 | 298,437 | 330,908 | 327,285 | 344,879 | 330,022 | 348,333 | 349,550 | 335,865 | 350,389 | 335,992 | 338,906 |
| 2014 | 350,445 | 316,531 | 350,445 | 364,710 | 376,867 | 364,710 | 382,532 | 382,532 | 370,192 | 394,203 | 381,487 | 394,203 |
| 2015 | 411,127 | 375,920 | 420,463 | 411,301 | 425,040 | 411,824 | 426,618 | 426,106 | 415,403 | 426,233 | 410,385 | 417,105 |
| 2016 | 477,949 | 448,722 | 480,003 | 465,160 | 481,537 | 465,144 | 476,436 | 473,956 | 452,142 | 465,814 | 443,292 | 447,416 |
| 2017 | 443,223 | 411,437 | 453,688 | 445,808 | 472,153 | 463,409 | 486,290 | 475,257 | 470,194 | 504,319 | 494,935 | 511,582 |
| 2018 | 491,354 | 456,601 | 520,211 | 511,558 | 541,607 | 531,943 | 558,112 | 576,997 | 565,512 | 590,379 | 579,904 | 609,651 |
| 2019 | 610,881 | 562,055 | 627,215 | 621,564 | 659,267 | 640,767 | 675,947 | 694,659 | 678,601 | 702,954 | 687,013 | 718,043 |
| 2020 | 746,322 | 694,035 | 757,652 | 713,768 | 663,346 | 663,835 | 697,133 | 705,728 | 681,062 | 703,619 | 685,347 | 705,304 |
| 2021 | 714,191 | 539,029 | 721,413 | 735,515 | 748,994 | 729,143 | 768,410 | 768,196 | 754,516 | 786,510 | 762,482 | 802,025 |
| 2022 | 789,385 | 706,310 | 805,075 | 792,848 | 817,348 | 786,886 | 826,054 | 834,274 | 818,041 | 849,883 | 820,341 | 830,347 |
| 2023 | NA | NA | NA | NA | NA | NA | NA | NA | NA | NA | NA | NA |
| 2024 | NA | |||||||||||
| - = No Data Reported; -- = Not Applicable; NA = Not Available; W = Withheld to avoid disclosure of individual company data. |
| Release Date: 3/29/2024 |
| Next Release Date: 4/30/2024 |