|
Download Data (XLS File) |
|
||||||||
|
||||||||
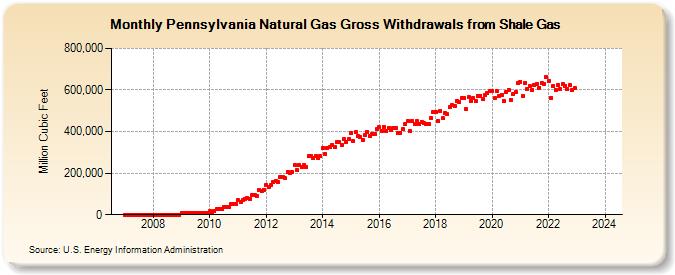
| Pennsylvania Natural Gas Gross Withdrawals from Shale Gas (Million Cubic Feet) | ||||||||
| Year | Jan | Feb | Mar | Apr | May | Jun | Jul | Aug | Sep | Oct | Nov | Dec |
|---|---|---|---|---|---|---|---|---|---|---|---|---|
| 2007 | 0 | 0 | 0 | 0 | 0 | 0 | 0 | 0 | 0 | 0 | 0 | 0 |
| 2008 | 826 | 773 | 826 | 800 | 826 | 800 | 826 | 826 | 800 | 826 | 800 | 826 |
| 2009 | 7,565 | 6,833 | 7,565 | 7,321 | 7,565 | 7,321 | 7,565 | 7,565 | 7,321 | 7,565 | 7,321 | 7,565 |
| 2010 | 15,835 | 14,303 | 15,835 | 26,860 | 27,756 | 26,860 | 38,452 | 38,452 | 37,211 | 53,202 | 51,485 | 53,202 |
| 2011 | 68,692 | 62,045 | 68,692 | 77,725 | 80,316 | 77,725 | 93,126 | 93,126 | 90,121 | 120,199 | 116,321 | 120,199 |
| 2012 | 143,632 | 134,365 | 143,632 | 156,230 | 161,438 | 156,230 | 180,639 | 180,639 | 174,812 | 205,886 | 199,244 | 205,886 |
| 2013 | 236,817 | 213,900 | 236,817 | 229,178 | 236,817 | 229,178 | 280,596 | 280,596 | 271,545 | 280,596 | 271,545 | 280,596 |
| 2014 | 322,151 | 290,975 | 322,151 | 325,796 | 336,656 | 325,796 | 348,750 | 348,750 | 337,500 | 363,218 | 351,501 | 363,218 |
| 2015 | 390,794 | 355,398 | 396,068 | 376,380 | 373,894 | 359,751 | 383,810 | 397,553 | 379,985 | 387,606 | 388,728 | 410,628 |
| 2016 | 419,661 | 404,813 | 421,071 | 404,278 | 416,233 | 409,168 | 418,131 | 416,259 | 391,843 | 395,254 | 410,089 | 434,374 |
| 2017 | 450,547 | 404,638 | 450,120 | 437,604 | 448,403 | 433,979 | 447,279 | 440,368 | 434,152 | 438,129 | 464,368 | 495,745 |
| 2018 | 494,846 | 452,847 | 498,876 | 466,061 | 489,942 | 482,554 | 517,546 | 526,418 | 522,914 | 547,976 | 540,713 | 560,188 |
| 2019 | 563,614 | 508,295 | 566,114 | 547,976 | 559,673 | 544,990 | 571,049 | 573,290 | 557,108 | 578,167 | 585,866 | 596,043 |
| 2020 | 593,350 | 559,602 | 593,362 | 572,700 | 577,941 | 546,926 | 590,839 | 600,495 | 551,990 | 581,064 | 591,359 | 632,870 |
| 2021 | 637,936 | 572,433 | 635,216 | 605,992 | 619,566 | 600,812 | 622,217 | 630,415 | 610,822 | 634,550 | 629,933 | 661,237 |
| 2022 | 641,987 | 563,253 | 618,893 | 599,969 | 623,705 | 602,327 | 629,486 | 620,952 | 604,554 | 622,877 | 599,258 | 610,459 |
| 2023 | NA | NA | NA | NA | NA | NA | NA | NA | NA | NA | NA | NA |
| 2024 | NA | |||||||||||
| - = No Data Reported; -- = Not Applicable; NA = Not Available; W = Withheld to avoid disclosure of individual company data. |
| Release Date: 3/29/2024 |
| Next Release Date: 4/30/2024 |