|
Download Data (XLS File) |
|
||||||||
|
||||||||
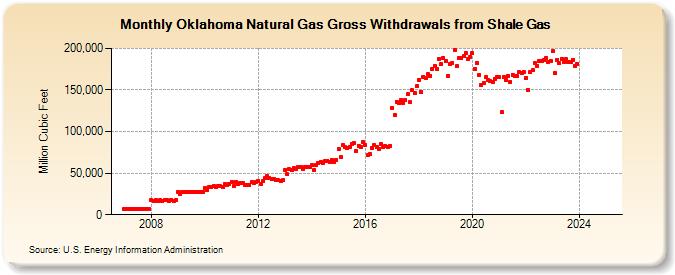
| Oklahoma Natural Gas Gross Withdrawals from Shale Gas (Million Cubic Feet) | ||||||||
| Year | Jan | Feb | Mar | Apr | May | Jun | Jul | Aug | Sep | Oct | Nov | Dec |
|---|---|---|---|---|---|---|---|---|---|---|---|---|
| 2007 | 7,051 | 6,368 | 7,051 | 6,823 | 7,051 | 6,823 | 7,051 | 7,051 | 6,823 | 7,051 | 6,823 | 7,051 |
| 2008 | 17,319 | 16,202 | 17,319 | 16,760 | 17,319 | 16,760 | 17,319 | 17,319 | 16,760 | 17,319 | 16,760 | 17,319 |
| 2009 | 27,841 | 25,147 | 27,841 | 26,943 | 27,841 | 26,943 | 27,841 | 27,841 | 26,943 | 27,841 | 26,943 | 27,841 |
| 2010 | 32,231 | 29,473 | 32,820 | 33,028 | 34,170 | 33,094 | 34,490 | 34,156 | 33,185 | 37,044 | 35,480 | 36,973 |
| 2011 | 39,101 | 34,001 | 39,397 | 37,316 | 38,390 | 37,953 | 35,659 | 36,079 | 35,534 | 38,858 | 37,747 | 39,130 |
| 2012 | 40,355 | 37,448 | 39,955 | 43,804 | 46,087 | 44,153 | 42,643 | 43,252 | 41,990 | 41,406 | 40,790 | 41,445 |
| 2013 | 54,203 | 48,587 | 54,437 | 53,930 | 56,093 | 54,476 | 57,008 | 56,956 | 55,565 | 57,922 | 57,383 | 56,948 |
| 2014 | 59,356 | 53,612 | 59,356 | 61,642 | 63,696 | 61,642 | 64,919 | 64,919 | 62,824 | 65,613 | 63,496 | 65,613 |
| 2015 | 79,278 | 69,078 | 83,589 | 80,870 | 79,735 | 81,929 | 84,515 | 86,044 | 76,284 | 82,839 | 80,986 | 87,352 |
| 2016 | 84,038 | 71,249 | 72,993 | 80,680 | 83,394 | 81,302 | 79,323 | 84,505 | 81,002 | 82,816 | 80,943 | 82,789 |
| 2017 | 128,861 | 119,981 | 136,135 | 134,111 | 138,122 | 134,650 | 137,763 | 144,832 | 134,950 | 149,472 | 146,161 | 154,298 |
| 2018 | 162,503 | 147,809 | 165,970 | 164,874 | 168,777 | 167,213 | 175,692 | 178,526 | 175,681 | 187,295 | 180,963 | 188,566 |
| 2019 | 184,716 | 166,959 | 180,661 | 182,473 | 197,711 | 178,309 | 188,309 | 188,034 | 190,299 | 194,600 | 187,648 | 190,088 |
| 2020 | 194,454 | 175,301 | 182,923 | 167,989 | 155,571 | 158,866 | 165,380 | 161,753 | 160,560 | 159,902 | 163,723 | 165,629 |
| 2021 | 165,190 | 123,115 | 165,023 | 161,731 | 166,968 | 159,635 | 168,437 | 166,965 | 166,431 | 171,561 | 170,304 | 171,752 |
| 2022 | 166,115 | 151,923 | 173,244 | 174,196 | 180,776 | 177,168 | 183,126 | 182,772 | 183,991 | 187,535 | 181,299 | 176,122 |
| 2023 | NA | NA | NA | NA | NA | NA | NA | NA | NA | NA | NA | NA |
| 2024 | NA | |||||||||||
| - = No Data Reported; -- = Not Applicable; NA = Not Available; W = Withheld to avoid disclosure of individual company data. |
| Release Date: 3/29/2024 |
| Next Release Date: 4/30/2024 |