|
Download Data (XLS File) |
|
||||||||
|
||||||||
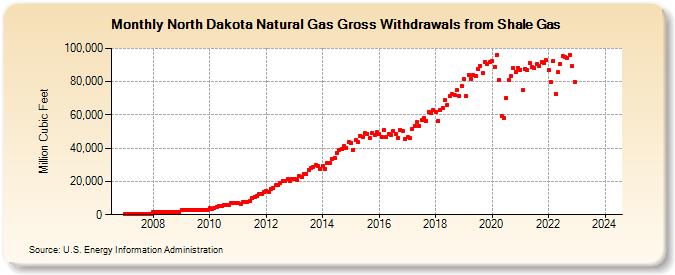
| North Dakota Natural Gas Gross Withdrawals from Shale Gas (Million Cubic Feet) | ||||||||
| Year | Jan | Feb | Mar | Apr | May | Jun | Jul | Aug | Sep | Oct | Nov | Dec |
|---|---|---|---|---|---|---|---|---|---|---|---|---|
| 2007 | 598 | 541 | 598 | 579 | 598 | 579 | 598 | 598 | 579 | 598 | 579 | 598 |
| 2008 | 1,572 | 1,470 | 1,572 | 1,521 | 1,572 | 1,521 | 1,572 | 1,572 | 1,521 | 1,572 | 1,521 | 1,572 |
| 2009 | 3,011 | 2,719 | 3,011 | 2,914 | 3,011 | 2,914 | 3,011 | 3,011 | 2,914 | 3,011 | 2,914 | 3,011 |
| 2010 | 3,782 | 3,686 | 4,182 | 4,656 | 5,141 | 5,034 | 5,947 | 6,072 | 6,098 | 6,851 | 6,855 | 6,757 |
| 2011 | 7,040 | 6,402 | 7,453 | 7,457 | 7,819 | 8,244 | 9,999 | 10,744 | 10,958 | 12,645 | 12,690 | 13,549 |
| 2012 | 14,518 | 13,934 | 15,737 | 16,160 | 17,677 | 17,703 | 19,188 | 20,318 | 20,552 | 21,244 | 20,129 | 21,714 |
| 2013 | 21,695 | 20,649 | 23,181 | 22,801 | 24,622 | 24,714 | 27,131 | 28,133 | 28,786 | 29,927 | 29,311 | 27,671 |
| 2014 | 28,989 | 27,446 | 31,132 | 31,144 | 33,767 | 34,283 | 37,195 | 38,771 | 39,569 | 41,342 | 40,039 | 43,611 |
| 2015 | 43,094 | 39,124 | 44,714 | 43,527 | 47,594 | 46,985 | 48,920 | 48,545 | 45,901 | 49,049 | 48,145 | 49,574 |
| 2016 | 48,631 | 46,977 | 50,878 | 46,743 | 48,826 | 47,664 | 50,296 | 48,492 | 46,181 | 50,975 | 50,627 | 45,605 |
| 2017 | 46,514 | 46,201 | 51,824 | 53,276 | 55,445 | 53,535 | 56,895 | 58,425 | 56,409 | 62,055 | 61,089 | 62,858 |
| 2018 | 61,636 | 56,620 | 62,955 | 64,439 | 68,722 | 66,090 | 71,306 | 72,296 | 71,798 | 75,098 | 71,252 | 77,337 |
| 2019 | 81,327 | 71,358 | 84,013 | 81,775 | 83,934 | 83,351 | 87,702 | 89,629 | 85,128 | 92,076 | 90,752 | 91,757 |
| 2020 | 92,210 | 88,879 | 95,972 | 80,720 | 59,118 | 58,349 | 70,373 | 80,706 | 83,227 | 88,387 | 85,554 | 88,381 |
| 2021 | 87,242 | 74,797 | 87,754 | 86,928 | 91,511 | 88,720 | 88,202 | 90,813 | 89,594 | 91,809 | 91,424 | 92,852 |
| 2022 | 87,093 | 79,573 | 92,353 | 72,821 | 85,517 | 90,799 | 95,153 | 94,557 | 94,269 | 96,194 | 89,128 | 80,038 |
| 2023 | NA | NA | NA | NA | NA | NA | NA | NA | NA | NA | NA | NA |
| 2024 | NA | |||||||||||
| - = No Data Reported; -- = Not Applicable; NA = Not Available; W = Withheld to avoid disclosure of individual company data. |
| Release Date: 3/29/2024 |
| Next Release Date: 4/30/2024 |