|
Download Data (XLS File) |
|
||||||||
|
||||||||
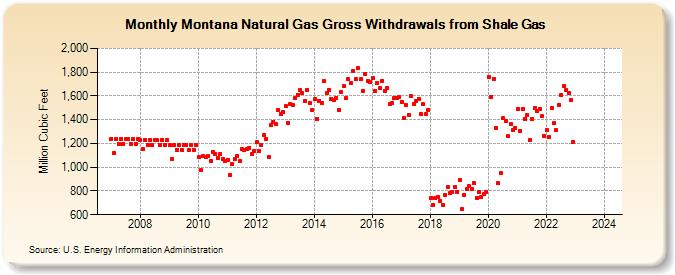
| Montana Natural Gas Gross Withdrawals from Shale Gas (Million Cubic Feet) | ||||||||
| Year | Jan | Feb | Mar | Apr | May | Jun | Jul | Aug | Sep | Oct | Nov | Dec |
|---|---|---|---|---|---|---|---|---|---|---|---|---|
| 2007 | 1,239 | 1,119 | 1,239 | 1,199 | 1,239 | 1,199 | 1,239 | 1,239 | 1,199 | 1,239 | 1,199 | 1,239 |
| 2008 | 1,229 | 1,150 | 1,229 | 1,189 | 1,229 | 1,189 | 1,229 | 1,229 | 1,189 | 1,229 | 1,189 | 1,229 |
| 2009 | 1,185 | 1,071 | 1,185 | 1,147 | 1,185 | 1,147 | 1,185 | 1,185 | 1,147 | 1,185 | 1,147 | 1,185 |
| 2010 | 1,083 | 973 | 1,091 | 1,085 | 1,094 | 1,056 | 1,132 | 1,113 | 1,076 | 1,112 | 1,070 | 1,054 |
| 2011 | 1,063 | 937 | 1,027 | 1,070 | 1,098 | 1,050 | 1,150 | 1,146 | 1,149 | 1,165 | 1,109 | 1,136 |
| 2012 | 1,209 | 1,134 | 1,184 | 1,268 | 1,240 | 1,085 | 1,354 | 1,383 | 1,361 | 1,483 | 1,449 | 1,468 |
| 2013 | 1,517 | 1,371 | 1,528 | 1,521 | 1,585 | 1,608 | 1,649 | 1,622 | 1,557 | 1,652 | 1,542 | 1,485 |
| 2014 | 1,570 | 1,405 | 1,560 | 1,544 | 1,722 | 1,621 | 1,650 | 1,575 | 1,562 | 1,585 | 1,483 | 1,633 |
| 2015 | 1,681 | 1,579 | 1,739 | 1,705 | 1,812 | 1,743 | 1,836 | 1,739 | 1,645 | 1,784 | 1,723 | 1,719 |
| 2016 | 1,754 | 1,645 | 1,708 | 1,664 | 1,728 | 1,645 | 1,668 | 1,528 | 1,537 | 1,586 | 1,581 | 1,589 |
| 2017 | 1,551 | 1,415 | 1,525 | 1,443 | 1,596 | 1,533 | 1,554 | 1,571 | 1,446 | 1,530 | 1,444 | 1,484 |
| 2018 | 742 | 683 | 737 | 748 | 718 | 684 | 769 | 830 | 782 | 790 | 834 | 794 |
| 2019 | 892 | 647 | 768 | 820 | 838 | 819 | 863 | 742 | 790 | 752 | 776 | 787 |
| 2020 | 1,758 | 1,592 | 1,743 | 1,328 | 864 | 948 | 1,410 | 1,386 | 1,262 | 1,361 | 1,315 | 1,334 |
| 2021 | 1,488 | 1,303 | 1,494 | 1,409 | 1,440 | 1,232 | 1,407 | 1,495 | 1,475 | 1,491 | 1,427 | 1,263 |
| 2022 | 1,309 | 1,256 | 1,498 | 1,368 | 1,310 | 1,520 | 1,605 | 1,684 | 1,646 | 1,628 | 1,562 | 1,212 |
| 2023 | NA | NA | NA | NA | NA | NA | NA | NA | NA | NA | NA | NA |
| 2024 | NA | |||||||||||
| - = No Data Reported; -- = Not Applicable; NA = Not Available; W = Withheld to avoid disclosure of individual company data. |
| Release Date: 3/29/2024 |
| Next Release Date: 4/30/2024 |