|
Download Data (XLS File) |
|
||||||||
|
||||||||
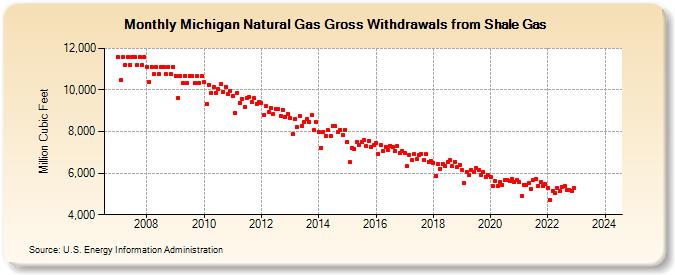
| Michigan Natural Gas Gross Withdrawals from Shale Gas (Million Cubic Feet) | ||||||||
| Year | Jan | Feb | Mar | Apr | May | Jun | Jul | Aug | Sep | Oct | Nov | Dec |
|---|---|---|---|---|---|---|---|---|---|---|---|---|
| 2007 | 11,582 | 10,461 | 11,582 | 11,208 | 11,582 | 11,208 | 11,582 | 11,582 | 11,208 | 11,582 | 11,208 | 11,582 |
| 2008 | 11,106 | 10,389 | 11,106 | 10,747 | 11,106 | 10,747 | 11,106 | 11,106 | 10,747 | 11,106 | 10,747 | 11,106 |
| 2009 | 10,669 | 9,636 | 10,669 | 10,324 | 10,669 | 10,324 | 10,669 | 10,669 | 10,324 | 10,669 | 10,324 | 10,669 |
| 2010 | 10,380 | 9,332 | 10,257 | 9,862 | 10,157 | 9,849 | 10,039 | 10,268 | 9,918 | 10,149 | 9,801 | 9,972 |
| 2011 | 9,725 | 8,903 | 9,852 | 9,389 | 9,577 | 9,177 | 9,631 | 9,673 | 9,445 | 9,596 | 9,335 | 9,432 |
| 2012 | 9,387 | 8,797 | 9,213 | 8,919 | 9,153 | 8,830 | 9,093 | 9,087 | 8,753 | 9,049 | 8,676 | 8,867 |
| 2013 | 8,651 | 7,866 | 8,626 | 8,200 | 8,745 | 8,282 | 8,470 | 8,627 | 8,464 | 8,775 | 8,065 | 8,437 |
| 2014 | 7,998 | 7,224 | 7,998 | 7,793 | 8,053 | 7,793 | 8,253 | 8,253 | 7,986 | 8,092 | 7,831 | 8,092 |
| 2015 | 7,508 | 6,515 | 7,225 | 7,163 | 7,508 | 7,343 | 7,519 | 7,587 | 7,295 | 7,566 | 7,241 | 7,336 |
| 2016 | 7,446 | 6,904 | 7,330 | 7,044 | 7,269 | 7,090 | 7,324 | 7,234 | 7,047 | 7,310 | 6,979 | 7,074 |
| 2017 | 6,980 | 6,325 | 6,882 | 6,650 | 6,903 | 6,669 | 6,888 | 6,924 | 6,624 | 6,901 | 6,556 | 6,600 |
| 2018 | 6,508 | 5,864 | 6,439 | 6,206 | 6,456 | 6,340 | 6,539 | 6,617 | 6,322 | 6,536 | 6,273 | 6,395 |
| 2019 | 6,132 | 5,530 | 6,041 | 5,915 | 6,156 | 6,042 | 6,229 | 6,158 | 5,926 | 6,070 | 5,830 | 5,902 |
| 2020 | 5,815 | 5,379 | 5,622 | 5,401 | 5,559 | 5,452 | 5,647 | 5,687 | 5,612 | 5,740 | 5,566 | 5,657 |
| 2021 | 5,569 | 4,915 | 5,430 | 5,413 | 5,509 | 5,250 | 5,672 | 5,734 | 5,383 | 5,565 | 5,388 | 5,454 |
| 2022 | 5,283 | 4,724 | 5,141 | 5,043 | 5,296 | 5,130 | 5,343 | 5,366 | 5,198 | 5,202 | 5,126 | 5,289 |
| 2023 | NA | NA | NA | NA | NA | NA | NA | NA | NA | NA | NA | NA |
| 2024 | NA | |||||||||||
| - = No Data Reported; -- = Not Applicable; NA = Not Available; W = Withheld to avoid disclosure of individual company data. |
| Release Date: 3/29/2024 |
| Next Release Date: 4/30/2024 |