|
Download Data (XLS File) |
|
||||||||
|
||||||||
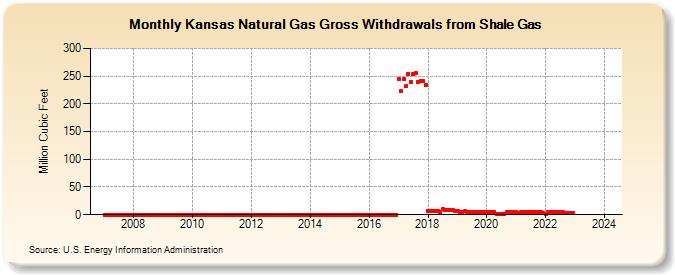
| Kansas Natural Gas Gross Withdrawals from Shale Gas (Million Cubic Feet) | ||||||||
| Year | Jan | Feb | Mar | Apr | May | Jun | Jul | Aug | Sep | Oct | Nov | Dec |
|---|---|---|---|---|---|---|---|---|---|---|---|---|
| 2007 | 0 | 0 | 0 | 0 | 0 | 0 | 0 | 0 | 0 | 0 | 0 | 0 |
| 2008 | 0 | 0 | 0 | 0 | 0 | 0 | 0 | 0 | 0 | 0 | 0 | 0 |
| 2009 | 0 | 0 | 0 | 0 | 0 | 0 | 0 | 0 | 0 | 0 | 0 | 0 |
| 2010 | 0 | 0 | 0 | 0 | 0 | 0 | 0 | 0 | 0 | 0 | 0 | 0 |
| 2011 | 0 | 0 | 0 | 0 | 0 | 0 | 0 | 0 | 0 | 0 | 0 | 0 |
| 2012 | 0 | 0 | 0 | 0 | 0 | 0 | 0 | 0 | 0 | 0 | 0 | 0 |
| 2013 | 0 | 0 | 0 | 0 | 0 | 0 | 0 | 0 | 0 | 0 | 0 | 0 |
| 2014 | 0 | 0 | 0 | 0 | 0 | 0 | 0 | 0 | 0 | 0 | 0 | 0 |
| 2015 | 0 | 0 | 0 | 0 | 0 | 0 | 0 | 0 | 0 | 0 | 0 | 0 |
| 2016 | 0 | 0 | 0 | 0 | 0 | 0 | 0 | 0 | 0 | 0 | 0 | 0 |
| 2017 | 244 | 223 | 244 | 233 | 254 | 239 | 253 | 256 | 240 | 242 | 241 | 234 |
| 2018 | 7 | 7 | 7 | 6 | 6 | 4 | 10 | 8 | 8 | 8 | 8 | 7 |
| 2019 | 7 | 5 | 5 | 6 | 5 | 5 | 4 | 5 | 4 | 4 | 4 | 5 |
| 2020 | 4 | 4 | 4 | 4 | 2 | 2 | 1 | 2 | 4 | 4 | 4 | 4 |
| 2021 | 4 | 3 | 4 | 4 | 4 | 4 | 5 | 5 | 4 | 4 | 4 | 3 |
| 2022 | 2 | 4 | 4 | 5 | 4 | 4 | 4 | 4 | 3 | 3 | 3 | 3 |
| 2023 | NA | NA | NA | NA | NA | NA | NA | NA | NA | NA | NA | NA |
| 2024 | NA | |||||||||||
| - = No Data Reported; -- = Not Applicable; NA = Not Available; W = Withheld to avoid disclosure of individual company data. |
| Release Date: 3/29/2024 |
| Next Release Date: 4/30/2024 |