|
Download Data (XLS File) |
|
||||||||
|
||||||||
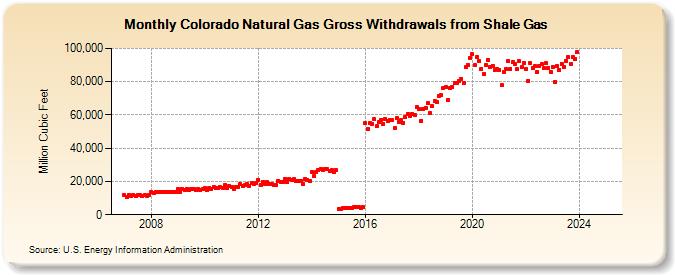
| Colorado Natural Gas Gross Withdrawals from Shale Gas (Million Cubic Feet) | ||||||||
| Year | Jan | Feb | Mar | Apr | May | Jun | Jul | Aug | Sep | Oct | Nov | Dec |
|---|---|---|---|---|---|---|---|---|---|---|---|---|
| 2007 | 11,749 | 10,612 | 11,749 | 11,370 | 11,749 | 11,370 | 11,749 | 11,749 | 11,370 | 11,749 | 11,370 | 11,749 |
| 2008 | 13,919 | 13,021 | 13,919 | 13,470 | 13,919 | 13,470 | 13,919 | 13,919 | 13,470 | 13,919 | 13,470 | 13,919 |
| 2009 | 15,314 | 13,832 | 15,314 | 14,820 | 15,314 | 14,820 | 15,314 | 15,314 | 14,820 | 15,314 | 14,820 | 15,314 |
| 2010 | 15,782 | 14,647 | 16,011 | 15,735 | 16,593 | 16,175 | 15,971 | 16,569 | 16,311 | 18,014 | 16,022 | 17,299 |
| 2011 | 16,927 | 15,686 | 16,887 | 16,934 | 18,226 | 17,256 | 17,687 | 18,398 | 17,459 | 19,034 | 18,170 | 18,824 |
| 2012 | 21,139 | 18,044 | 19,738 | 18,628 | 19,428 | 18,271 | 18,170 | 17,963 | 17,566 | 20,471 | 19,519 | 19,859 |
| 2013 | 21,496 | 19,504 | 21,407 | 20,977 | 21,384 | 20,165 | 20,294 | 20,273 | 18,465 | 21,715 | 21,057 | 20,306 |
| 2014 | 25,562 | 23,089 | 25,562 | 26,790 | 27,683 | 26,790 | 27,222 | 27,222 | 26,344 | 26,688 | 25,828 | 26,688 |
| 2015 | 3,568 | 3,614 | 4,151 | 4,054 | 3,973 | 4,172 | 4,151 | 4,374 | 4,409 | 4,554 | 4,291 | 4,460 |
| 2016 | 55,064 | 51,744 | 54,958 | 54,796 | 57,313 | 53,270 | 55,552 | 57,180 | 54,806 | 57,670 | 56,224 | 56,773 |
| 2017 | 56,930 | 52,019 | 57,946 | 55,905 | 56,810 | 55,325 | 58,525 | 60,515 | 59,293 | 60,581 | 60,164 | 64,555 |
| 2018 | 63,316 | 56,509 | 63,320 | 64,229 | 66,902 | 60,872 | 65,248 | 68,123 | 67,613 | 71,615 | 71,726 | 76,155 |
| 2019 | 76,529 | 69,164 | 75,951 | 76,973 | 78,979 | 79,304 | 80,274 | 81,858 | 79,066 | 88,574 | 90,253 | 94,269 |
| 2020 | 96,390 | 89,873 | 94,781 | 92,264 | 87,901 | 84,636 | 90,233 | 92,965 | 89,032 | 89,712 | 87,163 | 87,708 |
| 2021 | 87,061 | 77,779 | 85,802 | 87,400 | 92,327 | 87,616 | 91,523 | 90,372 | 87,386 | 92,175 | 88,556 | 91,394 |
| 2022 | 88,232 | 80,883 | 91,215 | 88,230 | 88,405 | 85,624 | 89,534 | 90,460 | 87,957 | 91,230 | 88,329 | 86,166 |
| 2023 | NA | NA | NA | NA | NA | NA | NA | NA | NA | NA | NA | NA |
| 2024 | NA | NA | ||||||||||
| - = No Data Reported; -- = Not Applicable; NA = Not Available; W = Withheld to avoid disclosure of individual company data. |
| Release Date: 4/30/2024 |
| Next Release Date: 5/31/2024 |