|
Download Data (XLS File) |
|
||||||||
|
||||||||
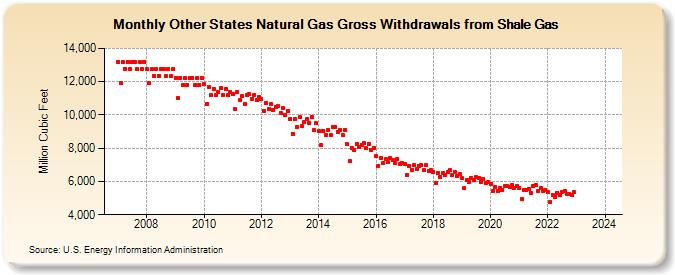
| Other States Natural Gas Gross Withdrawals from Shale Gas (Million Cubic Feet) | ||||||||
| Year | Jan | Feb | Mar | Apr | May | Jun | Jul | Aug | Sep | Oct | Nov | Dec |
|---|---|---|---|---|---|---|---|---|---|---|---|---|
| 2007 | 13,204 | 11,926 | 13,204 | 12,778 | 13,204 | 12,778 | 13,204 | 13,204 | 12,778 | 13,204 | 12,778 | 13,204 |
| 2008 | 12,755 | 11,932 | 12,755 | 12,343 | 12,755 | 12,343 | 12,755 | 12,755 | 12,343 | 12,755 | 12,343 | 12,755 |
| 2009 | 12,222 | 11,039 | 12,222 | 11,827 | 12,222 | 11,827 | 12,222 | 12,222 | 11,827 | 12,222 | 11,827 | 12,222 |
| 2010 | 11,842 | 10,659 | 11,705 | 11,180 | 11,541 | 11,189 | 11,357 | 11,589 | 11,208 | 11,559 | 11,185 | 11,402 |
| 2011 | 11,253 | 10,334 | 11,374 | 10,871 | 11,111 | 10,653 | 11,210 | 11,277 | 10,970 | 11,221 | 10,895 | 11,068 |
| 2012 | 10,980 | 10,262 | 10,744 | 10,346 | 10,634 | 10,319 | 10,470 | 10,529 | 10,127 | 10,399 | 9,992 | 10,233 |
| 2013 | 9,769 | 8,878 | 9,755 | 9,298 | 9,864 | 9,363 | 9,583 | 9,729 | 9,541 | 9,851 | 9,096 | 9,498 |
| 2014 | 9,055 | 8,179 | 9,055 | 8,816 | 9,109 | 8,816 | 9,299 | 9,299 | 8,999 | 9,114 | 8,820 | 9,114 |
| 2015 | 8,229 | 7,214 | 8,011 | 7,905 | 8,271 | 8,045 | 8,220 | 8,291 | 7,988 | 8,255 | 7,904 | 8,008 |
| 2016 | 7,503 | 6,953 | 7,388 | 7,100 | 7,327 | 7,149 | 7,386 | 7,296 | 7,106 | 7,370 | 7,038 | 7,130 |
| 2017 | 7,040 | 6,384 | 6,948 | 6,712 | 6,962 | 6,730 | 6,949 | 6,966 | 6,659 | 6,965 | 6,617 | 6,663 |
| 2018 | 6,569 | 5,916 | 6,499 | 6,260 | 6,509 | 6,396 | 6,591 | 6,677 | 6,379 | 6,595 | 6,328 | 6,447 |
| 2019 | 6,191 | 5,577 | 6,094 | 5,971 | 6,216 | 6,098 | 6,281 | 6,218 | 5,983 | 6,128 | 5,885 | 5,956 |
| 2020 | 5,870 | 5,428 | 5,677 | 5,455 | 5,613 | 5,505 | 5,703 | 5,741 | 5,665 | 5,794 | 5,616 | 5,708 |
| 2021 | 5,623 | 4,961 | 5,484 | 5,465 | 5,562 | 5,301 | 5,726 | 5,786 | 5,435 | 5,618 | 5,440 | 5,504 |
| 2022 | 5,337 | 4,771 | 5,192 | 5,092 | 5,323 | 5,180 | 5,392 | 5,419 | 5,247 | 5,252 | 5,174 | 5,338 |
| 2023 | NA | NA | NA | NA | NA | NA | NA | NA | NA | NA | NA | NA |
| 2024 | NA | |||||||||||
| - = No Data Reported; -- = Not Applicable; NA = Not Available; W = Withheld to avoid disclosure of individual company data. |
| Release Date: 3/29/2024 |
| Next Release Date: 4/30/2024 |