|
Download Data (XLS File) |
|
||||||||
|
||||||||
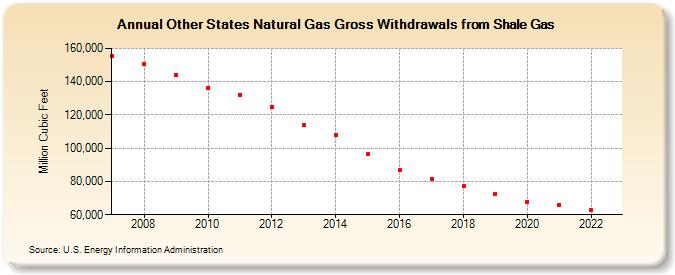
| Other States Natural Gas Gross Withdrawals from Shale Gas (Million Cubic Feet) | ||||||||
| Decade | Year-0 | Year-1 | Year-2 | Year-3 | Year-4 | Year-5 | Year-6 | Year-7 | Year-8 | Year-9 |
|---|---|---|---|---|---|---|---|---|---|---|
| 2000's | 155,467 | 150,587 | 143,898 | |||||||
| 2010's | 136,417 | 132,236 | 125,034 | 114,224 | 107,675 | 96,340 | 86,746 | 81,595 | 77,166 | 72,598 |
| 2020's | 67,774 | 65,906 | 62,717 |
| - = No Data Reported; -- = Not Applicable; NA = Not Available; W = Withheld to avoid disclosure of individual company data. |
| Release Date: 3/29/2024 |
| Next Release Date: 4/30/2024 |