|
Download Data (XLS File) |
|
||||||||
|
||||||||
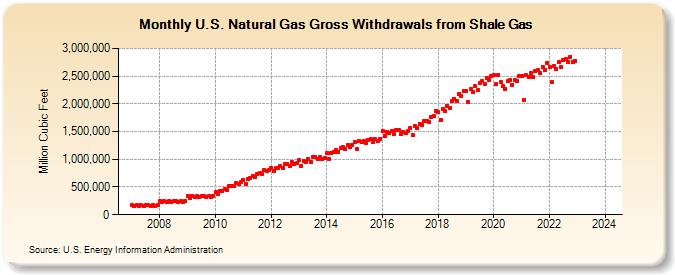
| U.S. Natural Gas Gross Withdrawals from Shale Gas (Million Cubic Feet) | ||||||||
| Year | Jan | Feb | Mar | Apr | May | Jun | Jul | Aug | Sep | Oct | Nov | Dec |
|---|---|---|---|---|---|---|---|---|---|---|---|---|
| 2007 | 169,026 | 152,669 | 169,026 | 163,574 | 169,026 | 163,574 | 169,026 | 169,026 | 163,574 | 169,026 | 163,574 | 169,026 |
| 2008 | 243,084 | 227,401 | 243,084 | 235,243 | 243,084 | 235,243 | 243,084 | 243,084 | 235,243 | 243,084 | 235,243 | 243,084 |
| 2009 | 336,186 | 303,652 | 336,186 | 325,341 | 336,186 | 325,341 | 336,186 | 336,186 | 325,341 | 336,186 | 325,341 | 336,186 |
| 2010 | 406,673 | 375,550 | 423,948 | 433,217 | 454,828 | 444,215 | 516,703 | 522,784 | 513,320 | 572,200 | 562,774 | 590,909 |
| 2011 | 626,998 | 562,261 | 652,767 | 669,549 | 700,130 | 679,587 | 729,338 | 744,380 | 731,041 | 806,763 | 787,075 | 811,094 |
| 2012 | 850,081 | 779,826 | 836,494 | 842,792 | 875,482 | 851,601 | 911,084 | 918,391 | 886,755 | 944,911 | 907,216 | 928,226 |
| 2013 | 977,938 | 885,538 | 975,914 | 958,819 | 997,613 | 959,035 | 1,047,840 | 1,045,229 | 1,004,528 | 1,044,998 | 1,009,572 | 1,025,503 |
| 2014 | 1,105,060 | 999,368 | 1,107,193 | 1,129,856 | 1,169,229 | 1,133,072 | 1,212,228 | 1,213,729 | 1,176,663 | 1,255,581 | 1,215,058 | 1,257,899 |
| 2015 | 1,303,184 | 1,183,482 | 1,336,504 | 1,305,443 | 1,335,558 | 1,287,771 | 1,346,412 | 1,361,877 | 1,308,824 | 1,359,164 | 1,320,749 | 1,370,350 |
| 2016 | 1,515,623 | 1,426,005 | 1,499,248 | 1,468,682 | 1,518,351 | 1,463,590 | 1,523,883 | 1,521,640 | 1,448,961 | 1,488,769 | 1,467,124 | 1,505,663 |
| 2017 | 1,562,121 | 1,438,680 | 1,607,345 | 1,568,742 | 1,643,892 | 1,614,519 | 1,688,557 | 1,694,366 | 1,677,823 | 1,766,484 | 1,787,812 | 1,877,261 |
| 2018 | 1,850,680 | 1,704,589 | 1,915,467 | 1,869,862 | 1,966,679 | 1,922,264 | 2,045,869 | 2,092,618 | 2,059,835 | 2,183,049 | 2,136,395 | 2,229,941 |
| 2019 | 2,231,082 | 2,034,214 | 2,264,257 | 2,221,029 | 2,314,917 | 2,251,907 | 2,378,255 | 2,403,284 | 2,350,433 | 2,460,040 | 2,426,542 | 2,504,871 |
| 2020 | 2,513,867 | 2,351,637 | 2,524,957 | 2,385,364 | 2,315,568 | 2,273,712 | 2,404,336 | 2,437,599 | 2,346,572 | 2,430,689 | 2,412,047 | 2,503,689 |
| 2021 | 2,505,571 | 2,076,596 | 2,514,904 | 2,475,838 | 2,551,126 | 2,476,793 | 2,591,107 | 2,610,084 | 2,551,916 | 2,663,159 | 2,614,030 | 2,729,218 |
| 2022 | 2,628,007 | 2,389,734 | 2,691,660 | 2,638,512 | 2,739,576 | 2,658,524 | 2,776,001 | 2,790,274 | 2,742,637 | 2,849,673 | 2,765,237 | 2,808,419 |
| 2023 | 2,879,913 | 2,598,968 | 2,920,574 | 2,819,253 | 2,942,269 | 2,817,793 | 2,934,368 | 2,946,312 | 2,852,428 | 2,948,400 | 2,899,826 | 3,000,142 |
| 2024 | 2,933,236 | 2,809,450 | 2,937,344 | 2,830,162 | 2,923,784 | 2,863,907 | 3,008,693 | 2,987,637 | 2,866,034 | 2,999,481 | 2,903,960 | 3,045,807 |
| 2025 | NA | NA | NA | NA | NA | NA | NA | NA | NA | NA | NA | NA |
| 2026 | NA | NA | NA | NA | ||||||||
| - = No Data Reported; -- = Not Applicable; NA = Not Available; W = Withheld to avoid disclosure of individual company data. |
| Release Date: 6/30/2026 |
| Next Release Date: 7/31/2026 |