|
Download Data (XLS File) |
|
||||||||
|
||||||||
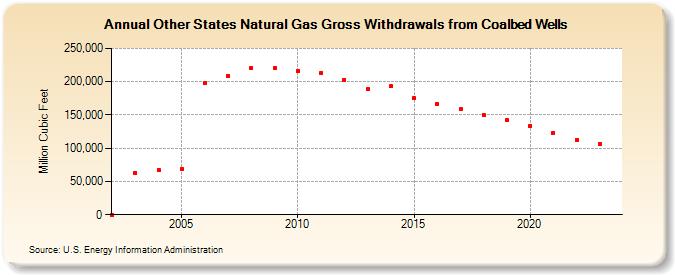
| Other States Natural Gas Gross Withdrawals from Coalbed Wells (Million Cubic Feet) | ||||||||
| Decade | Year-0 | Year-1 | Year-2 | Year-3 | Year-4 | Year-5 | Year-6 | Year-7 | Year-8 | Year-9 |
|---|---|---|---|---|---|---|---|---|---|---|
| 2000's | 0 | 62,764 | 66,869 | 69,289 | 197,614 | 208,942 | 221,038 | 220,892 | ||
| 2010's | 216,717 | 213,309 | 202,744 | 188,862 | 192,833 | 175,283 | 166,457 | 158,222 | 150,600 | 141,860 |
| 2020's | 133,754 | 122,946 | 113,199 |
| - = No Data Reported; -- = Not Applicable; NA = Not Available; W = Withheld to avoid disclosure of individual company data. |
| Release Date: 3/29/2024 |
| Next Release Date: 4/30/2024 |