|
Download Data (XLS File) |
|
||||||||
|
||||||||
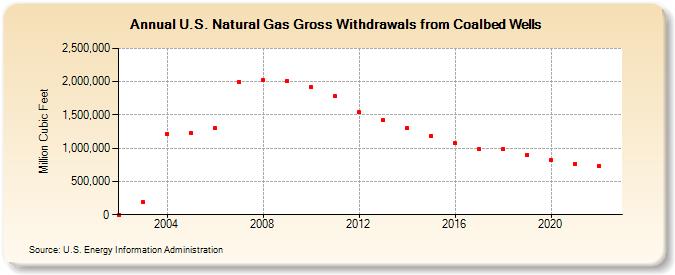
| U.S. Natural Gas Gross Withdrawals from Coalbed Wells (Million Cubic Feet) | ||||||||
| Decade | Year-0 | Year-1 | Year-2 | Year-3 | Year-4 | Year-5 | Year-6 | Year-7 | Year-8 | Year-9 |
|---|---|---|---|---|---|---|---|---|---|---|
| 2000's | 0 | 188,749 | 1,216,108 | 1,224,943 | 1,304,493 | 1,999,748 | 2,022,228 | 2,010,171 | ||
| 2010's | 1,916,762 | 1,779,055 | 1,539,395 | 1,425,783 | 1,307,072 | 1,186,420 | 1,071,062 | 985,653 | 980,730 | 902,544 |
| 2020's | 823,593 | 762,875 | 734,314 |
| - = No Data Reported; -- = Not Applicable; NA = Not Available; W = Withheld to avoid disclosure of individual company data. |
| Release Date: 3/29/2024 |
| Next Release Date: 4/30/2024 |