|
Download Data (XLS File) |
|
||||||||
|
||||||||
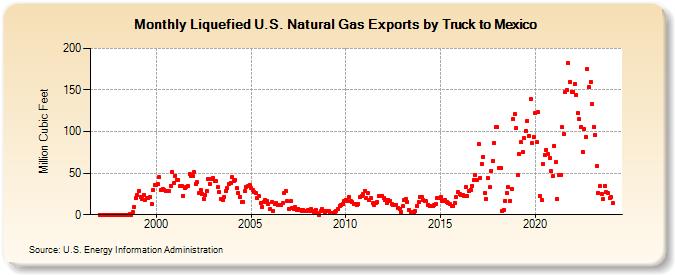
| Liquefied U.S. Natural Gas Exports by Truck to Mexico (Million Cubic Feet) | ||||||||
| Year | Jan | Feb | Mar | Apr | May | Jun | Jul | Aug | Sep | Oct | Nov | Dec |
|---|---|---|---|---|---|---|---|---|---|---|---|---|
| 1997 | 0 | 0 | 0 | 0 | 0 | 0 | 0 | 0 | 0 | 0 | 0 | 0 |
| 1998 | 0 | 0 | 0 | 0 | 0 | 0 | 0 | 1 | 0 | 3 | 9 | 20 |
| 1999 | 24 | 29 | 21 | 19 | 24 | 18 | 20 | 20 | 21 | 13 | 30 | 36 |
| 2000 | 36 | 37 | 45 | 30 | 31 | 30 | 29 | 29 | 28 | 35 | 51 | 38 |
| 2001 | 47 | 42 | 42 | 34 | 35 | 23 | 32 | 33 | 35 | 49 | 47 | 46 |
| 2002 | 51 | 37 | 39 | 26 | 30 | 25 | 19 | 24 | 28 | 43 | 37 | 43 |
| 2003 | 44 | 40 | 40 | 33 | 27 | 19 | 18 | 21 | 28 | 32 | 37 | 38 |
| 2004 | 45 | 41 | 42 | 32 | 26 | 21 | 15 | 15 | 28 | 33 | 34 | 36 |
| 2005 | 32 | 30 | 27 | 26 | 20 | 22 | 14 | 9 | 15 | 18 | 17 | 13 |
| 2006 | 7 | 15 | 5 | 13 | 14 | 12 | 12 | 12 | 14 | 26 | 28 | 16 |
| 2007 | 7 | 16 | 8 | 7 | 9 | 6 | 7 | 6 | 5 | 6 | 5 | 5 |
| 2008 | 6 | 5 | 7 | 5 | 3 | 6 | 2 | 0 | 4 | 7 | 5 | 3 |
| 2009 | 4 | 4 | 2 | 2 | 2 | 3 | 5 | 7 | 11 | 12 | 13 | 17 |
| 2010 | 18 | 17 | 21 | 16 | 15 | 13 | 13 | 12 | 13 | 21 | 23 | 25 |
| 2011 | 29 | 20 | 26 | 18 | 20 | 14 | 12 | 14 | 15 | 22 | 23 | 23 |
| 2012 | 20 | 18 | 14 | 18 | 17 | 13 | 12 | 12 | 12 | 8 | 7 | 3 |
| 2013 | 10 | 18 | 19 | 15 | 6 | 3 | 3 | 2 | 4 | 11 | 15 | 21 |
| 2014 | 21 | 18 | 17 | 16 | 12 | 10 | 11 | 10 | 12 | 13 | 20 | 20 |
| 2015 | 21 | 16 | 17 | 18 | 15 | 14 | 13 | 10 | 11 | 14 | 21 | 27 |
| 2016 | 25 | 24 | 24 | 23 | 33 | 22 | 28 | 30 | 35 | 42 | 48 | 42 |
| 2017 | 85 | 44 | 61 | 70 | 26 | 19 | 44 | 33 | 53 | 65 | 86 | 105 |
| 2018 | 105 | 56 | 56 | 4 | 6 | 17 | 26 | 33 | 17 | 31 | 115 | 121 |
| 2019 | 104 | 48 | 73 | 87 | 75 | 92 | 101 | 113 | 95 | 139 | 86 | 93 |
| 2020 | 122 | 87 | 123 | 23 | 18 | 61 | 72 | 78 | 73 | 68 | 52 | 46 |
| 2021 | 83 | 63 | 19 | 48 | 48 | 105 | 97 | 147 | 150 | 182 | 160 | 148 |
| 2022 | 148 | 157 | 144 | 122 | 115 | 105 | 76 | 103 | 94 | 175 | 153 | 160 |
| 2023 | 133 | 106 | 96 | 58 | 26 | 34 | 25 | 19 | 35 | 27 | 26 | 20 |
| 2024 | 21 | 14 | ||||||||||
| - = No Data Reported; -- = Not Applicable; NA = Not Available; W = Withheld to avoid disclosure of individual company data. |
| Release Date: 4/30/2024 |
| Next Release Date: 5/31/2024 |
Referring Pages: