|
Download Data (XLS File) |
|
||||||||
|
||||||||
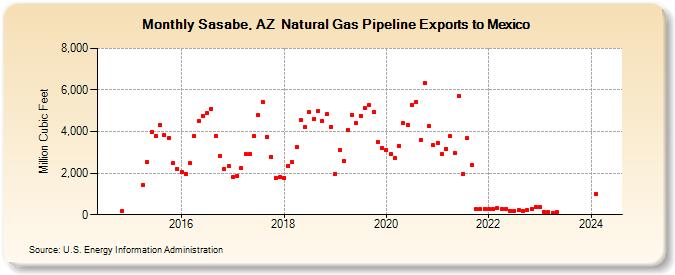
| Sasabe, AZ Natural Gas Pipeline Exports to Mexico (Million Cubic Feet) | ||||||||
| Year | Jan | Feb | Mar | Apr | May | Jun | Jul | Aug | Sep | Oct | Nov | Dec |
|---|---|---|---|---|---|---|---|---|---|---|---|---|
| 2014 | 180 | |||||||||||
| 2015 | 1,436 | 2,518 | 3,978 | 3,783 | 4,309 | 3,846 | 3,687 | 2,474 | 2,220 | |||
| 2016 | 2,059 | 1,968 | 2,487 | 3,796 | 4,520 | 4,763 | 4,885 | 5,090 | 3,787 | 2,804 | 2,197 | 2,342 |
| 2017 | 1,790 | 1,869 | 2,229 | 2,914 | 2,944 | 3,801 | 4,784 | 5,427 | 3,756 | 2,799 | 1,763 | 1,793 |
| 2018 | 1,779 | 2,356 | 2,531 | 3,261 | 4,549 | 4,207 | 4,926 | 4,598 | 4,978 | 4,507 | 4,826 | 4,232 |
| 2019 | 1,976 | 3,114 | 2,602 | 4,076 | 4,816 | 4,411 | 4,760 | 5,111 | 5,268 | 4,932 | 3,518 | 3,202 |
| 2020 | 3,122 | 2,908 | 2,718 | 3,305 | 4,396 | 4,338 | 5,299 | 5,428 | 3,606 | 6,338 | 4,248 | 3,347 |
| 2021 | 3,436 | 2,930 | 3,184 | 3,763 | 2,986 | 5,686 | 1,966 | 3,675 | 2,402 | 255 | 266 | 266 |
| 2022 | 282 | 271 | 306 | 271 | 284 | 202 | 180 | 207 | 156 | 221 | 267 | 359 |
| 2023 | 353 | 108 | 110 | 105 | 153 | |||||||
| 2024 | 991 | |||||||||||
| - = No Data Reported; -- = Not Applicable; NA = Not Available; W = Withheld to avoid disclosure of individual company data. |
| Release Date: 4/30/2024 |
| Next Release Date: 5/31/2024 |