|
Download Data (XLS File) |
|
||||||||
|
||||||||
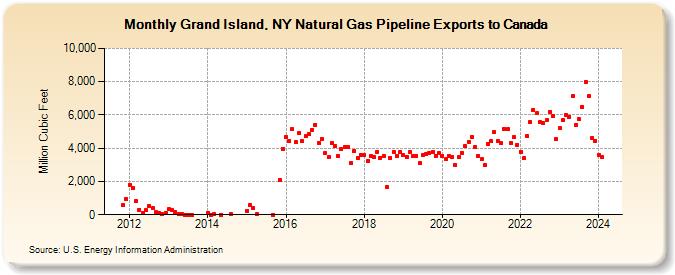
| Grand Island, NY Natural Gas Pipeline Exports to Canada (Million Cubic Feet) | ||||||||
| Year | Jan | Feb | Mar | Apr | May | Jun | Jul | Aug | Sep | Oct | Nov | Dec |
|---|---|---|---|---|---|---|---|---|---|---|---|---|
| 2011 | 586 | 931 | ||||||||||
| 2012 | 1,802 | 1,578 | 824 | 304 | 116 | 261 | 526 | 386 | 159 | 111 | 17 | 109 |
| 2013 | 314 | 277 | 161 | 47 | 20 | 10 | 10 | 11 | ||||
| 2014 | 132 | 1 | 14 | 8 | 19 | |||||||
| 2015 | 224 | 565 | 378 | 15 | 0 | 2,098 | 3,980 | |||||
| 2016 | 4,677 | 4,425 | 5,142 | 4,348 | 4,900 | 4,411 | 4,708 | 4,824 | 5,098 | 5,422 | 4,332 | 4,558 |
| 2017 | 3,707 | 3,462 | 4,304 | 4,115 | 3,541 | 3,937 | 4,060 | 4,060 | 3,092 | 3,851 | 3,439 | 3,612 |
| 2018 | 3,588 | 3,211 | 3,545 | 3,479 | 3,793 | 3,433 | 3,541 | 1,679 | 3,432 | 3,780 | 3,553 | 3,771 |
| 2019 | 3,584 | 3,491 | 3,794 | 3,510 | 3,556 | 3,096 | 3,562 | 3,627 | 3,730 | 3,767 | 3,546 | 3,703 |
| 2020 | 3,554 | 3,328 | 3,553 | 3,495 | 2,984 | 3,457 | 3,713 | 4,105 | 4,384 | 4,673 | 4,067 | 3,541 |
| 2021 | 3,334 | 2,966 | 4,240 | 4,413 | 4,956 | 4,444 | 4,300 | 5,174 | 5,134 | 4,338 | 4,660 | 4,206 |
| 2022 | 3,791 | 3,399 | 4,726 | 5,567 | 6,320 | 6,099 | 5,555 | 5,496 | 5,669 | 6,193 | 5,961 | 4,539 |
| 2023 | 5,189 | 5,685 | 6,005 | 5,892 | 7,116 | 5,417 | 5,737 | 6,488 | 8,009 | 7,130 | 4,639 | 4,462 |
| 2024 | 3,586 | |||||||||||
| - = No Data Reported; -- = Not Applicable; NA = Not Available; W = Withheld to avoid disclosure of individual company data. |
| Release Date: 3/29/2024 |
| Next Release Date: 4/30/2024 |