|
Download Data (XLS File) |
|
||||||||
|
||||||||
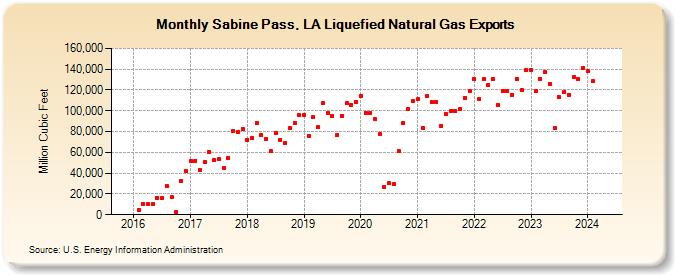
| Sabine Pass, LA Liquefied Natural Gas Exports (Million Cubic Feet) | ||||||||
| Year | Jan | Feb | Mar | Apr | May | Jun | Jul | Aug | Sep | Oct | Nov | Dec |
|---|---|---|---|---|---|---|---|---|---|---|---|---|
| 2016 | 4,574 | 10,598 | 10,010 | 9,840 | 16,421 | 15,703 | 27,481 | 16,715 | 2,942 | 32,910 | 41,761 | |
| 2017 | 51,235 | 51,982 | 43,469 | 50,584 | 60,741 | 52,427 | 53,539 | 45,419 | 54,665 | 80,535 | 79,993 | 82,479 |
| 2018 | 72,334 | 73,581 | 88,460 | 76,723 | 72,857 | 60,915 | 79,002 | 72,239 | 68,988 | 83,401 | 88,140 | 95,562 |
| 2019 | 95,748 | 75,564 | 93,602 | 84,065 | 107,005 | 97,739 | 95,194 | 76,669 | 95,250 | 107,359 | 106,014 | 108,451 |
| 2020 | 114,283 | 98,008 | 98,021 | 91,733 | 77,635 | 26,910 | 30,230 | 29,316 | 61,674 | 88,331 | 101,396 | 109,365 |
| 2021 | 111,069 | 83,808 | 114,128 | 108,858 | 108,224 | 85,813 | 96,748 | 99,325 | 99,615 | 101,288 | 112,754 | 119,053 |
| 2022 | 130,131 | 110,916 | 130,486 | 124,560 | 130,733 | 105,690 | 118,542 | 118,672 | 115,637 | 130,421 | 120,073 | 139,166 |
| 2023 | 139,242 | 119,455 | 130,970 | 136,989 | 126,154 | 83,744 | 113,328 | 118,486 | 115,400 | 132,427 | 130,427 | 141,519 |
| 2024 | 137,771 | 128,285 | ||||||||||
| - = No Data Reported; -- = Not Applicable; NA = Not Available; W = Withheld to avoid disclosure of individual company data. |
| Release Date: 4/30/2024 |
| Next Release Date: 5/31/2024 |