|
Download Data (XLS File) |
|
||||||||
|
||||||||
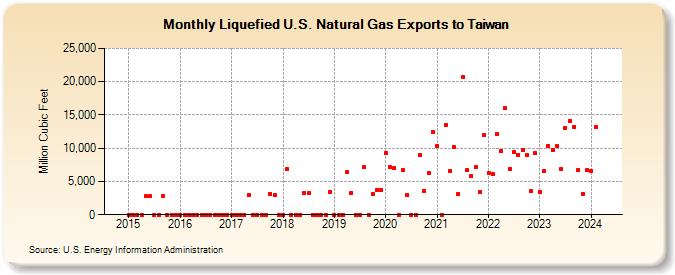
| Liquefied U.S. Natural Gas Exports to Taiwan (Million Cubic Feet) | ||||||||
| Year | Jan | Feb | Mar | Apr | May | Jun | Jul | Aug | Sep | Oct | Nov | Dec |
|---|---|---|---|---|---|---|---|---|---|---|---|---|
| 2015 | 0 | 0 | 0 | 0 | 2,748 | 2,754 | 0 | 0 | 2,755 | 0 | 0 | 0 |
| 2016 | 0 | 0 | 0 | 0 | 0 | 0 | 0 | 0 | 0 | 0 | 0 | 0 |
| 2017 | 0 | 0 | 0 | 0 | 2,949 | 0 | 0 | 0 | 0 | 3,121 | 2,934 | 0 |
| 2018 | 0 | 6,806 | 0 | 0 | 0 | 3,268 | 3,234 | 0 | 0 | 0 | 0 | 3,423 |
| 2019 | 0 | 0 | 0 | 6,349 | 3,309 | 0 | 0 | 7,207 | 0 | 3,138 | 3,736 | 3,658 |
| 2020 | 9,317 | 7,115 | 6,987 | 0 | 6,662 | 2,953 | 0 | 0 | 9,007 | 3,636 | 6,216 | 12,470 |
| 2021 | 10,319 | 0 | 13,450 | 6,594 | 10,157 | 3,097 | 20,653 | 6,728 | 5,789 | 7,123 | 3,404 | 12,034 |
| 2022 | 6,211 | 6,115 | 12,161 | 9,541 | 15,975 | 6,892 | 9,353 | 8,901 | 9,753 | 9,041 | 3,592 | 9,203 |
| 2023 | 3,471 | 6,557 | 10,311 | 9,774 | 10,262 | 6,848 | 13,090 | 14,117 | 13,201 | 6,686 | 3,104 | 6,655 |
| 2024 | 6,555 | |||||||||||
| - = No Data Reported; -- = Not Applicable; NA = Not Available; W = Withheld to avoid disclosure of individual company data. |
| Release Date: 3/29/2024 |
| Next Release Date: 4/30/2024 |