|
Download Data (XLS File) |
|
||||||||
|
||||||||
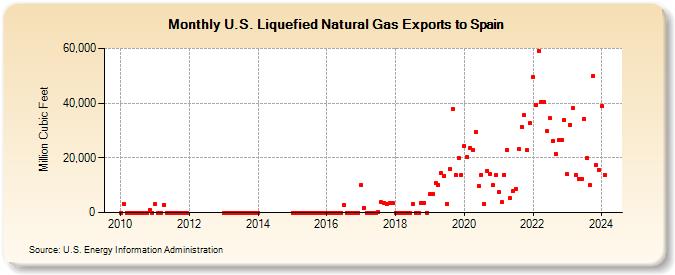
| U.S. Liquefied Natural Gas Exports to Spain (Million Cubic Feet) | ||||||||
| Year | Jan | Feb | Mar | Apr | May | Jun | Jul | Aug | Sep | Oct | Nov | Dec |
|---|---|---|---|---|---|---|---|---|---|---|---|---|
| 2010 | 0 | 3,149 | 0 | 0 | 0 | 0 | 0 | 0 | 0 | 0 | 968 | 0 |
| 2011 | 3,007 | 0 | 0 | 2,911 | 0 | 0 | 0 | 0 | 0 | 0 | 0 | 0 |
| 2013 | 0 | 0 | 0 | 0 | 0 | 0 | 0 | 0 | 0 | 0 | 0 | 0 |
| 2014 | 0 | |||||||||||
| 2015 | 0 | 0 | 0 | 0 | 0 | 0 | 0 | 0 | 0 | 0 | 0 | 0 |
| 2016 | 0 | 0 | 0 | 0 | 0 | 0 | 2,930 | 0 | 0 | 0 | 0 | 0 |
| 2017 | 10,002 | 1,766 | 0 | 0 | 0 | 0 | 217 | 3,712 | 3,666 | 2,980 | 3,617 | 3,370 |
| 2018 | 0 | 0 | 0 | 0 | 0 | 0 | 3,230 | 0 | 0 | 3,551 | 3,529 | 0 |
| 2019 | 6,631 | 6,748 | 10,678 | 10,139 | 14,325 | 13,506 | 3,297 | 15,861 | 37,938 | 13,704 | 19,985 | 13,874 |
| 2020 | 24,412 | 20,240 | 23,657 | 22,943 | 29,360 | 9,640 | 13,679 | 3,222 | 15,206 | 14,118 | 9,907 | 13,583 |
| 2021 | 7,377 | 3,733 | 13,900 | 22,974 | 5,234 | 7,833 | 8,630 | 23,068 | 31,274 | 35,638 | 22,821 | 32,579 |
| 2022 | 49,379 | 39,359 | 59,224 | 40,259 | 40,337 | 29,639 | 34,396 | 26,140 | 21,263 | 26,369 | 26,445 | 33,847 |
| 2023 | 13,987 | 32,138 | 38,096 | 13,680 | 12,266 | 12,274 | 34,106 | 20,023 | 9,933 | 49,792 | 17,280 | 15,629 |
| 2024 | 38,812 | |||||||||||
| - = No Data Reported; -- = Not Applicable; NA = Not Available; W = Withheld to avoid disclosure of individual company data. |
| Release Date: 3/29/2024 |
| Next Release Date: 4/30/2024 |