|
Download Data (XLS File) |
|
||||||||
|
||||||||
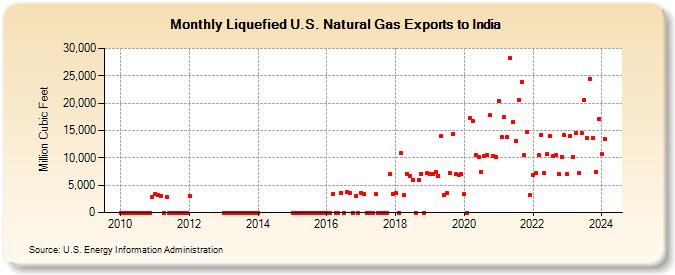
| Liquefied U.S. Natural Gas Exports to India (Million Cubic Feet) | ||||||||
| Year | Jan | Feb | Mar | Apr | May | Jun | Jul | Aug | Sep | Oct | Nov | Dec |
|---|---|---|---|---|---|---|---|---|---|---|---|---|
| 2010 | 0 | 0 | 0 | 0 | 0 | 0 | 0 | 0 | 0 | 0 | 0 | 2,873 |
| 2011 | 3,477 | 3,120 | 3,072 | 0 | 2,873 | 0 | 0 | 0 | 0 | 0 | 0 | 0 |
| 2012 | 3,004 | |||||||||||
| 2013 | 0 | 0 | 0 | 0 | 0 | 0 | 0 | 0 | 0 | 0 | 0 | 0 |
| 2014 | 0 | |||||||||||
| 2015 | 0 | 0 | 0 | 0 | 0 | 0 | 0 | 0 | 0 | 0 | 0 | 0 |
| 2016 | 0 | 0 | 3,390 | 0 | 0 | 3,617 | 0 | 3,701 | 3,639 | 0 | 3,115 | 0 |
| 2017 | 3,623 | 3,399 | 0 | 0 | 0 | 3,413 | 0 | 0 | 0 | 0 | 7,057 | 3,427 |
| 2018 | 3,596 | 0 | 10,834 | 3,254 | 7,118 | 6,717 | 5,918 | 0 | 5,910 | 7,131 | 0 | 7,156 |
| 2019 | 7,030 | 6,989 | 7,446 | 6,742 | 13,942 | 3,215 | 3,485 | 7,294 | 14,355 | 6,961 | 6,933 | 7,090 |
| 2020 | 3,309 | 0 | 17,245 | 16,674 | 10,534 | 10,100 | 7,404 | 10,319 | 10,514 | 17,762 | 10,299 | 10,241 |
| 2021 | 20,367 | 13,776 | 17,381 | 13,752 | 28,259 | 16,503 | 13,090 | 20,592 | 23,941 | 10,548 | 14,807 | 3,203 |
| 2022 | 6,866 | 7,210 | 10,438 | 14,223 | 7,152 | 10,653 | 13,902 | 10,265 | 10,528 | 7,005 | 10,138 | 14,139 |
| 2023 | 6,956 | 14,064 | 10,230 | 14,585 | 7,140 | 14,488 | 20,494 | 13,713 | 24,452 | 13,698 | 7,441 | 17,062 |
| 2024 | 10,685 | |||||||||||
| - = No Data Reported; -- = Not Applicable; NA = Not Available; W = Withheld to avoid disclosure of individual company data. |
| Release Date: 3/29/2024 |
| Next Release Date: 4/30/2024 |