|
Download Data (XLS File) |
|
||||||||
|
||||||||
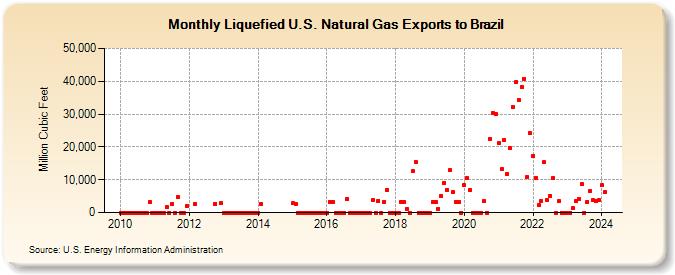
| Liquefied U.S. Natural Gas Exports to Brazil (Million Cubic Feet) | ||||||||
| Year | Jan | Feb | Mar | Apr | May | Jun | Jul | Aug | Sep | Oct | Nov | Dec |
|---|---|---|---|---|---|---|---|---|---|---|---|---|
| 2010 | 0 | 0 | 0 | 0 | 0 | 0 | 0 | 0 | 0 | 0 | 3,279 | 0 |
| 2011 | 0 | 0 | 0 | 0 | 1,680 | 0 | 2,581 | 0 | 4,681 | 0 | 0 | 2,108 |
| 2012 | 2,601 | 2,644 | 2,897 | |||||||||
| 2013 | 0 | 0 | 0 | 0 | 0 | 0 | 0 | 0 | 0 | 0 | 0 | 0 |
| 2014 | 0 | 2,664 | ||||||||||
| 2015 | 2,805 | 2,728 | 0 | 0 | 0 | 0 | 0 | 0 | 0 | 0 | 0 | 0 |
| 2016 | 0 | 3,284 | 3,270 | 0 | 0 | 0 | 0 | 4,075 | 0 | 0 | 0 | 0 |
| 2017 | 0 | 0 | 0 | 0 | 3,676 | 0 | 3,642 | 0 | 3,364 | 6,967 | 0 | 0 |
| 2018 | 0 | 0 | 3,272 | 3,255 | 1,153 | 0 | 12,540 | 15,425 | 0 | 0 | 0 | 0 |
| 2019 | 0 | 3,234 | 3,283 | 1,201 | 4,905 | 9,116 | 6,949 | 12,868 | 6,117 | 3,345 | 3,279 | 0 |
| 2020 | 8,438 | 10,433 | 6,891 | 0 | 0 | 0 | 0 | 3,520 | 0 | 22,508 | 30,191 | 29,927 |
| 2021 | 21,132 | 13,118 | 21,977 | 11,615 | 19,726 | 32,293 | 39,637 | 34,204 | 38,282 | 40,769 | 10,715 | 24,246 |
| 2022 | 17,322 | 10,660 | 2,236 | 3,448 | 15,303 | 3,857 | 5,192 | 10,542 | 0 | 3,439 | 0 | 0 |
| 2023 | 0 | 0 | 1,334 | 3,598 | 4,196 | 8,628 | 0 | 3,287 | 6,561 | 3,720 | 3,563 | 3,708 |
| 2024 | 8,292 | 6,180 | ||||||||||
| - = No Data Reported; -- = Not Applicable; NA = Not Available; W = Withheld to avoid disclosure of individual company data. |
| Release Date: 4/30/2024 |
| Next Release Date: 5/31/2024 |