|
Download Data (XLS File) |
|
||||||||
|
||||||||
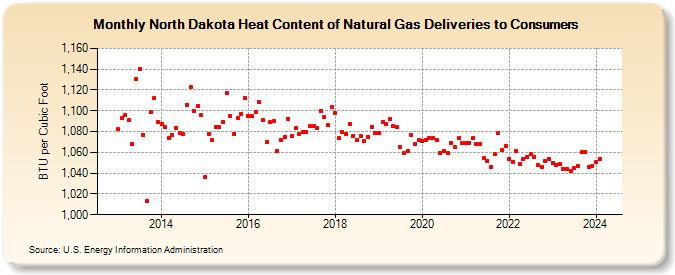
| North Dakota Heat Content of Natural Gas Deliveries to Consumers (BTU per Cubic Foot) | ||||||||
| Year | Jan | Feb | Mar | Apr | May | Jun | Jul | Aug | Sep | Oct | Nov | Dec |
|---|---|---|---|---|---|---|---|---|---|---|---|---|
| 2013 | 1,082 | 1,093 | 1,096 | 1,091 | 1,068 | 1,131 | 1,140 | 1,077 | 1,013 | 1,099 | 1,112 | 1,089 |
| 2014 | 1,087 | 1,084 | 1,074 | 1,077 | 1,083 | 1,079 | 1,078 | 1,106 | 1,123 | 1,100 | 1,105 | 1,096 |
| 2015 | 1,036 | 1,078 | 1,072 | 1,084 | 1,084 | 1,089 | 1,117 | 1,095 | 1,078 | 1,093 | 1,097 | 1,112 |
| 2016 | 1,095 | 1,095 | 1,099 | 1,108 | 1,091 | 1,070 | 1,089 | 1,090 | 1,061 | 1,072 | 1,075 | 1,092 |
| 2017 | 1,076 | 1,083 | 1,078 | 1,080 | 1,080 | 1,085 | 1,085 | 1,083 | 1,100 | 1,094 | 1,086 | 1,104 |
| 2018 | 1,098 | 1,074 | 1,080 | 1,078 | 1,087 | 1,076 | 1,072 | 1,076 | 1,071 | 1,075 | 1,084 | 1,079 |
| 2019 | 1,079 | 1,089 | 1,087 | 1,092 | 1,085 | 1,084 | 1,065 | 1,059 | 1,061 | 1,077 | 1,068 | 1,072 |
| 2020 | 1,071 | 1,072 | 1,074 | 1,074 | 1,072 | 1,059 | 1,061 | 1,059 | 1,069 | 1,065 | 1,074 | 1,069 |
| 2021 | 1,069 | 1,069 | 1,074 | 1,068 | 1,068 | 1,055 | 1,052 | 1,046 | 1,058 | 1,079 | 1,062 | 1,066 |
| 2022 | 1,054 | 1,051 | 1,061 | 1,049 | 1,054 | 1,056 | 1,058 | 1,056 | 1,048 | 1,046 | 1,052 | 1,054 |
| 2023 | 1,050 | 1,048 | 1,049 | 1,044 | 1,044 | 1,042 | 1,045 | 1,047 | 1,060 | 1,060 | 1,046 | 1,047 |
| 2024 | 1,051 | 1,054 | ||||||||||
| - = No Data Reported; -- = Not Applicable; NA = Not Available; W = Withheld to avoid disclosure of individual company data. |
| Release Date: 4/30/2024 |
| Next Release Date: 5/31/2024 |