|
Download Data (XLS File) |
|
|||||
|
|||||
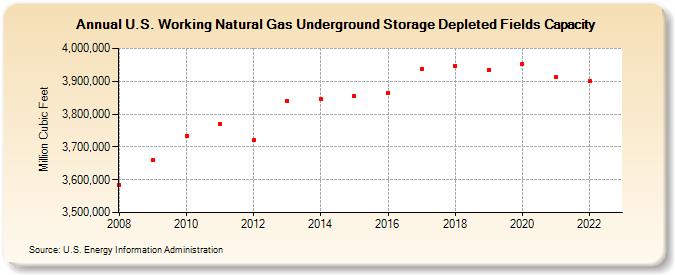
| U.S. Working Natural Gas Underground Storage Depleted Fields Capacity (Million Cubic Feet) | |||||
| Decade | Year-0 | Year-1 | Year-2 | Year-3 | Year-4 | Year-5 | Year-6 | Year-7 | Year-8 | Year-9 |
|---|---|---|---|---|---|---|---|---|---|---|
| 2000's | 3,583,786 | 3,659,968 | ||||||||
| 2010's | 3,733,993 | 3,769,113 | 3,720,980 | 3,839,852 | 3,844,927 | 3,854,408 | 3,864,269 | 3,937,382 | 3,946,955 | 3,935,134 |
| 2020's | 3,953,740 | 3,912,646 | 3,901,394 |
| - = No Data Reported; -- = Not Applicable; NA = Not Available; W = Withheld to avoid disclosure of individual company data. |
| Release Date: 3/29/2024 |
| Next Release Date: 4/30/2024 |