|
Download Data (XLS File) |
|
||||||||
|
||||||||
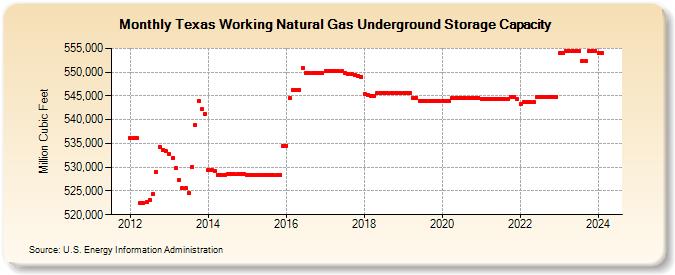
| Texas Working Natural Gas Underground Storage Capacity (Million Cubic Feet) | ||||||||
| Year | Jan | Feb | Mar | Apr | May | Jun | Jul | Aug | Sep | Oct | Nov | Dec |
|---|---|---|---|---|---|---|---|---|---|---|---|---|
| 2012 | 536,164 | 536,164 | 536,164 | 522,364 | 522,364 | 522,689 | 523,188 | 524,344 | 528,898 | 534,165 | 533,701 | 533,336 |
| 2013 | 532,698 | 531,872 | 529,744 | 527,288 | 525,544 | 525,544 | 524,564 | 530,086 | 538,858 | 543,905 | 542,161 | 541,161 |
| 2014 | 529,488 | 529,488 | 529,217 | 528,430 | 528,430 | 528,430 | 528,485 | 528,485 | 528,485 | 528,485 | 528,485 | 528,485 |
| 2015 | 528,445 | 528,445 | 528,445 | 528,445 | 528,445 | 528,445 | 528,445 | 528,335 | 528,335 | 528,335 | 528,335 | 534,539 |
| 2016 | 534,539 | 544,485 | 546,285 | 546,285 | 546,285 | 550,887 | 549,887 | 549,887 | 549,887 | 549,887 | 549,887 | 549,887 |
| 2017 | 550,137 | 550,137 | 550,137 | 550,137 | 550,137 | 550,163 | 549,894 | 549,693 | 549,580 | 549,345 | 549,264 | 549,049 |
| 2018 | 545,366 | 545,196 | 545,014 | 545,014 | 545,640 | 545,640 | 545,640 | 545,640 | 545,640 | 545,640 | 545,640 | 545,640 |
| 2019 | 545,640 | 545,640 | 545,640 | 544,640 | 544,640 | 543,975 | 543,975 | 543,975 | 543,975 | 543,975 | 543,975 | 543,975 |
| 2020 | 544,026 | 544,026 | 544,026 | 544,665 | 544,665 | 544,665 | 544,665 | 544,665 | 544,665 | 544,665 | 544,665 | 544,665 |
| 2021 | 544,435 | 544,435 | 544,435 | 544,435 | 544,435 | 544,435 | 544,435 | 544,435 | 544,295 | 544,795 | 544,795 | 544,315 |
| 2022 | 543,345 | 543,675 | 543,675 | 543,675 | 543,675 | 544,815 | 544,815 | 544,815 | 544,805 | 544,805 | 544,806 | 544,806 |
| 2023 | 553,943 | 553,943 | 554,483 | 554,483 | 554,483 | 554,483 | 554,483 | 552,300 | 552,301 | 554,483 | 554,483 | 554,483 |
| 2024 | 554,019 | 554,019 | ||||||||||
| - = No Data Reported; -- = Not Applicable; NA = Not Available; W = Withheld to avoid disclosure of individual company data. |
| Release Date: 4/30/2024 |
| Next Release Date: 5/31/2024 |
Referring Pages: