|
Download Data (XLS File) |
|
||||||||
|
||||||||
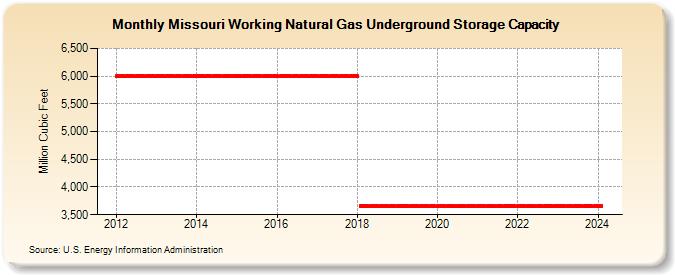
| Missouri Working Natural Gas Underground Storage Capacity (Million Cubic Feet) | ||||||||
| Year | Jan | Feb | Mar | Apr | May | Jun | Jul | Aug | Sep | Oct | Nov | Dec |
|---|---|---|---|---|---|---|---|---|---|---|---|---|
| 2012 | 6,000 | 6,000 | 6,000 | 6,000 | 6,000 | 6,000 | 6,000 | 6,000 | 6,000 | 6,000 | 6,000 | 6,000 |
| 2013 | 6,000 | 6,000 | 6,000 | 6,000 | 6,000 | 6,000 | 6,000 | 6,000 | 6,000 | 6,000 | 6,000 | 6,000 |
| 2014 | 6,000 | 6,000 | 6,000 | 6,000 | 6,000 | 6,000 | 6,000 | 6,000 | 6,000 | 6,000 | 6,000 | 6,000 |
| 2015 | 6,000 | 6,000 | 6,000 | 6,000 | 6,000 | 6,000 | 6,000 | 6,000 | 6,000 | 6,000 | 6,000 | 6,000 |
| 2016 | 6,000 | 6,000 | 6,000 | 6,000 | 6,000 | 6,000 | 6,000 | 6,000 | 6,000 | 6,000 | 6,000 | 6,000 |
| 2017 | 6,000 | 6,000 | 6,000 | 6,000 | 6,000 | 6,000 | 6,000 | 6,000 | 6,000 | 6,000 | 6,000 | 6,000 |
| 2018 | 6,000 | 3,656 | 3,656 | 3,656 | 3,656 | 3,656 | 3,656 | 3,656 | 3,656 | 3,656 | 3,656 | 3,656 |
| 2019 | 3,656 | 3,656 | 3,656 | 3,656 | 3,656 | 3,656 | 3,656 | 3,656 | 3,656 | 3,656 | 3,656 | 3,656 |
| 2020 | 3,656 | 3,656 | 3,656 | 3,656 | 3,656 | 3,656 | 3,656 | 3,656 | 3,656 | 3,656 | 3,656 | 3,656 |
| 2021 | 3,656 | 3,656 | 3,656 | 3,656 | 3,656 | 3,656 | 3,656 | 3,656 | 3,656 | 3,656 | 3,656 | 3,656 |
| 2022 | 3,656 | 3,656 | 3,656 | 3,656 | 3,656 | 3,656 | 3,656 | 3,656 | 3,656 | 3,656 | 3,656 | 3,656 |
| 2023 | 3,656 | 3,656 | 3,656 | 3,656 | 3,656 | 3,656 | 3,656 | 3,656 | 3,656 | 3,656 | 3,656 | 3,656 |
| 2024 | 3,656 | |||||||||||
| - = No Data Reported; -- = Not Applicable; NA = Not Available; W = Withheld to avoid disclosure of individual company data. |
| Release Date: 3/29/2024 |
| Next Release Date: 4/30/2024 |