|
Download Data (XLS File) |
|
||||||||
|
||||||||
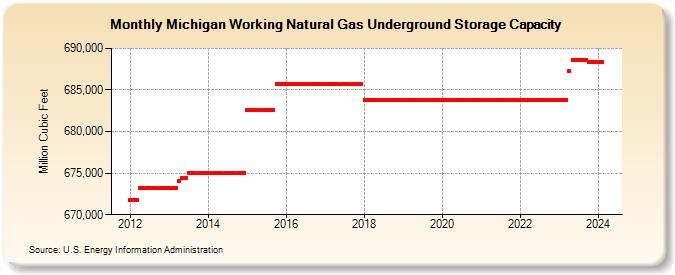
| Michigan Working Natural Gas Underground Storage Capacity (Million Cubic Feet) | ||||||||
| Year | Jan | Feb | Mar | Apr | May | Jun | Jul | Aug | Sep | Oct | Nov | Dec |
|---|---|---|---|---|---|---|---|---|---|---|---|---|
| 2012 | 671,824 | 671,824 | 671,824 | 673,200 | 673,200 | 673,200 | 673,200 | 673,200 | 673,200 | 673,200 | 673,200 | 673,200 |
| 2013 | 673,200 | 673,200 | 673,200 | 674,010 | 674,455 | 674,455 | 674,967 | 674,967 | 674,967 | 674,967 | 674,967 | 674,967 |
| 2014 | 674,967 | 674,967 | 674,967 | 674,967 | 674,967 | 674,967 | 674,967 | 674,967 | 674,967 | 674,967 | 674,967 | 675,003 |
| 2015 | 682,569 | 682,569 | 682,569 | 682,569 | 682,569 | 682,569 | 682,569 | 682,569 | 682,569 | 685,726 | 685,726 | 685,726 |
| 2016 | 685,726 | 685,726 | 685,726 | 685,726 | 685,726 | 685,726 | 685,726 | 685,726 | 685,726 | 685,726 | 685,726 | 685,726 |
| 2017 | 685,726 | 685,726 | 685,709 | 685,709 | 685,709 | 685,709 | 685,709 | 685,709 | 685,709 | 685,709 | 685,709 | 685,709 |
| 2018 | 683,820 | 683,820 | 683,820 | 683,820 | 683,820 | 683,820 | 683,820 | 683,820 | 683,820 | 683,820 | 683,820 | 683,820 |
| 2019 | 683,820 | 683,820 | 683,820 | 683,820 | 683,820 | 683,820 | 683,820 | 683,820 | 683,820 | 683,820 | 683,820 | 683,820 |
| 2020 | 683,820 | 683,820 | 683,820 | 683,820 | 683,820 | 683,820 | 683,820 | 683,820 | 683,820 | 683,820 | 683,820 | 683,820 |
| 2021 | 683,820 | 683,820 | 683,820 | 683,820 | 683,820 | 683,820 | 683,820 | 683,820 | 683,820 | 683,820 | 683,820 | 683,820 |
| 2022 | 683,820 | 683,820 | 683,820 | 683,820 | 683,820 | 683,820 | 683,820 | 683,820 | 683,820 | 683,821 | 683,801 | 683,801 |
| 2023 | 683,801 | 683,801 | 683,801 | 687,277 | 688,645 | 688,645 | 688,645 | 688,645 | 688,645 | 688,359 | 688,359 | 688,390 |
| 2024 | 688,390 | 688,390 | ||||||||||
| - = No Data Reported; -- = Not Applicable; NA = Not Available; W = Withheld to avoid disclosure of individual company data. |
| Release Date: 4/30/2024 |
| Next Release Date: 5/31/2024 |