|
Download Data (XLS File) |
|
||||||||
|
||||||||
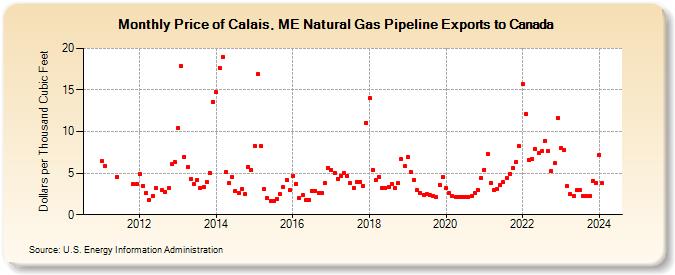
| Price of Calais, ME Natural Gas Pipeline Exports to Canada (Dollars per Thousand Cubic Feet) | ||||||||
| Year | Jan | Feb | Mar | Apr | May | Jun | Jul | Aug | Sep | Oct | Nov | Dec |
|---|---|---|---|---|---|---|---|---|---|---|---|---|
| 2011 | 6.45 | 5.86 | 4.53 | 3.69 | 3.67 | |||||||
| 2012 | 4.88 | 3.49 | 2.65 | 1.81 | 2.28 | 3.18 | 2.93 | 2.71 | 3.25 | 6.04 | 6.33 | |
| 2013 | 10.44 | 17.83 | 6.97 | 5.75 | 4.33 | 3.72 | 4.21 | 3.26 | 3.38 | 3.96 | 5.02 | 13.54 |
| 2014 | 14.70 | 17.69 | 19.02 | 5.11 | 3.81 | 4.55 | 2.86 | 2.67 | 3.12 | 2.47 | 5.75 | 5.35 |
| 2015 | 8.28 | 16.90 | 8.24 | 3.05 | 1.97 | 1.62 | 1.67 | 1.92 | 2.49 | 3.34 | 4.21 | 2.92 |
| 2016 | 4.71 | 3.74 | 2.01 | 2.40 | 1.77 | 1.81 | 2.89 | 2.90 | 2.62 | 2.56 | 3.76 | 5.62 |
| 2017 | 5.38 | 5.06 | 4.35 | 4.64 | 5.02 | 4.61 | 3.79 | 3.22 | 3.95 | 3.98 | 3.45 | 11.08 |
| 2018 | 13.98 | 5.42 | 4.20 | 4.54 | 3.22 | 3.20 | 3.37 | 3.66 | 3.23 | 3.79 | 6.69 | 5.84 |
| 2019 | 6.95 | 5.08 | 4.21 | 2.93 | 2.64 | 2.43 | 2.45 | 2.32 | 2.30 | 2.14 | 3.61 | 4.53 |
| 2020 | 3.21 | 2.67 | 2.20 | 2.18 | 2.07 | 2.18 | 2.16 | 2.12 | 2.20 | 2.63 | 2.93 | 4.43 |
| 2021 | 5.40 | 7.34 | 3.84 | 2.96 | 3.14 | 3.55 | 3.88 | 4.40 | 4.93 | 5.67 | 6.37 | 8.24 |
| 2022 | 15.69 | 12.13 | 6.61 | 6.73 | 7.90 | 7.42 | 7.62 | 8.92 | 7.67 | 5.22 | 6.18 | 11.68 |
| 2023 | 8.01 | 7.83 | 3.42 | 2.50 | 2.31 | 2.96 | 2.94 | 2.23 | 2.21 | 2.26 | 4.09 | 3.79 |
| 2024 | 7.19 | |||||||||||
| - = No Data Reported; -- = Not Applicable; NA = Not Available; W = Withheld to avoid disclosure of individual company data. |
| Release Date: 3/29/2024 |
| Next Release Date: 4/30/2024 |