|
Download Data (XLS File) |
|
|||||
|
|||||
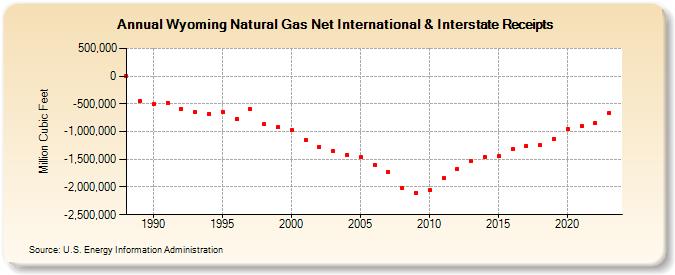
| Wyoming Natural Gas Net International & Interstate Receipts (Million Cubic Feet) | |||||
| Decade | Year-0 | Year-1 | Year-2 | Year-3 | Year-4 | Year-5 | Year-6 | Year-7 | Year-8 | Year-9 |
|---|---|---|---|---|---|---|---|---|---|---|
| 1980's | 0 | -451,250 | ||||||||
| 1990's | -512,049 | -476,738 | -585,561 | -650,336 | -675,475 | -640,884 | -775,410 | -595,034 | -864,676 | -920,258 |
| 2000's | -969,909 | -1,148,613 | -1,273,199 | -1,356,658 | -1,418,236 | -1,464,850 | -1,607,534 | -1,731,082 | -2,012,513 | -2,100,342 |
| 2010's | -2,051,446 | -1,844,573 | -1,666,609 | -1,528,467 | -1,453,160 | -1,443,579 | -1,321,206 | -1,257,979 | -1,250,558 | -1,126,619 |
| 2020's | -962,723 | -899,762 | -842,211 |
| - = No Data Reported; -- = Not Applicable; NA = Not Available; W = Withheld to avoid disclosure of individual company data. |
| Release Date: 4/30/2024 |
| Next Release Date: 5/31/2024 |