|
Download Data (XLS File) |
|
|||||
|
|||||
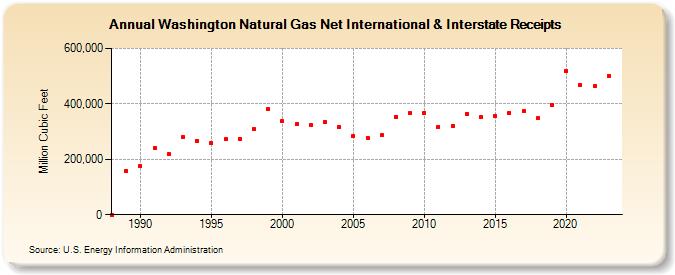
| Washington Natural Gas Net International & Interstate Receipts (Million Cubic Feet) | |||||
| Decade | Year-0 | Year-1 | Year-2 | Year-3 | Year-4 | Year-5 | Year-6 | Year-7 | Year-8 | Year-9 |
|---|---|---|---|---|---|---|---|---|---|---|
| 1980's | 0 | 158,293 | ||||||||
| 1990's | 176,878 | 240,421 | 218,706 | 280,957 | 267,623 | 257,498 | 272,653 | 273,757 | 308,654 | 380,767 |
| 2000's | 337,629 | 325,459 | 321,967 | 333,569 | 316,411 | 283,359 | 277,552 | 286,323 | 353,463 | 367,052 |
| 2010's | 367,026 | 317,344 | 320,125 | 364,397 | 351,035 | 355,582 | 367,311 | 372,368 | 347,379 | 396,960 |
| 2020's | 518,534 | 468,505 | 462,568 |
| - = No Data Reported; -- = Not Applicable; NA = Not Available; W = Withheld to avoid disclosure of individual company data. |
| Release Date: 4/30/2024 |
| Next Release Date: 5/31/2024 |