|
Download Data (XLS File) |
|
|||||
|
|||||
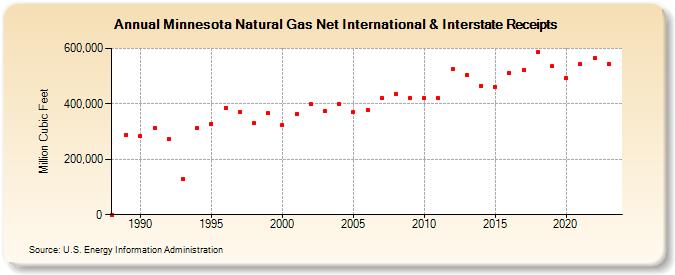
| Minnesota Natural Gas Net International & Interstate Receipts (Million Cubic Feet) | |||||
| Decade | Year-0 | Year-1 | Year-2 | Year-3 | Year-4 | Year-5 | Year-6 | Year-7 | Year-8 | Year-9 |
|---|---|---|---|---|---|---|---|---|---|---|
| 1980's | 0 | 288,584 | ||||||||
| 1990's | 283,594 | 314,521 | 273,537 | 128,761 | 311,890 | 328,537 | 386,690 | 371,358 | 330,620 | 365,627 |
| 2000's | 323,663 | 362,989 | 399,252 | 372,844 | 398,619 | 369,791 | 377,562 | 420,205 | 436,767 | 420,057 |
| 2010's | 421,774 | 419,605 | 524,156 | 504,259 | 465,679 | 461,899 | 511,876 | 522,143 | 586,635 | 536,283 |
| 2020's | 493,001 | 542,655 | 564,883 |
| - = No Data Reported; -- = Not Applicable; NA = Not Available; W = Withheld to avoid disclosure of individual company data. |
| Release Date: 4/30/2024 |
| Next Release Date: 5/31/2024 |