|
Download Data (XLS File) |
|
|||||
|
|||||
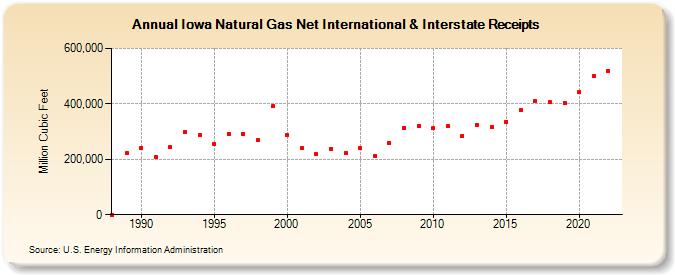
| Iowa Natural Gas Net International & Interstate Receipts (Million Cubic Feet) | |||||
| Decade | Year-0 | Year-1 | Year-2 | Year-3 | Year-4 | Year-5 | Year-6 | Year-7 | Year-8 | Year-9 |
|---|---|---|---|---|---|---|---|---|---|---|
| 1980's | 0 | 221,706 | ||||||||
| 1990's | 240,629 | 208,278 | 242,675 | 297,167 | 287,281 | 255,594 | 291,899 | 291,581 | 267,998 | 390,907 |
| 2000's | 287,948 | 240,413 | 218,104 | 238,243 | 223,253 | 238,896 | 212,844 | 260,249 | 314,166 | 320,078 |
| 2010's | 311,171 | 319,080 | 285,608 | 325,303 | 316,532 | 335,551 | 377,358 | 409,576 | 404,869 | 403,757 |
| 2020's | 442,529 | 499,245 | 517,816 |
| - = No Data Reported; -- = Not Applicable; NA = Not Available; W = Withheld to avoid disclosure of individual company data. |
| Release Date: 4/30/2024 |
| Next Release Date: 5/31/2024 |
Referring Pages: