|
Download Data (XLS File) |
|
|||||
|
|||||
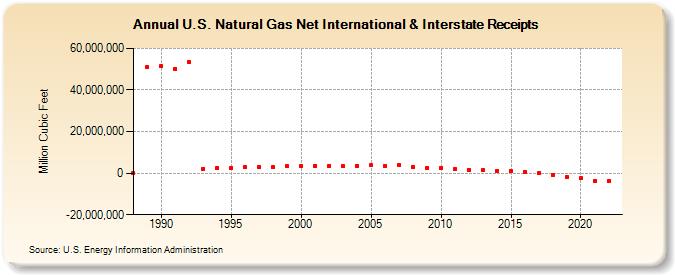
| U.S. Natural Gas Net International & Interstate Receipts (Million Cubic Feet) | |||||
| Decade | Year-0 | Year-1 | Year-2 | Year-3 | Year-4 | Year-5 | Year-6 | Year-7 | Year-8 | Year-9 |
|---|---|---|---|---|---|---|---|---|---|---|
| 1980's | 0 | 51,151,097 | ||||||||
| 1990's | 51,464,146 | 50,200,246 | 53,277,237 | 2,209,931 | 2,477,361 | 2,686,929 | 2,784,020 | 2,868,547 | 3,015,170 | 3,411,302 |
| 2000's | 3,467,210 | 3,567,946 | 3,557,469 | 3,345,940 | 3,495,034 | 3,710,404 | 3,489,919 | 3,778,879 | 2,989,770 | 2,664,874 |
| 2010's | 2,595,084 | 1,999,552 | 1,575,676 | 1,364,469 | 1,207,946 | 991,146 | 740,693 | -107,044 | -730,717 | -1,923,867 |
| 2020's | -2,526,209 | -3,660,057 | -3,789,101 |
| - = No Data Reported; -- = Not Applicable; NA = Not Available; W = Withheld to avoid disclosure of individual company data. |
| Release Date: 4/30/2024 |
| Next Release Date: 5/31/2024 |
Referring Pages: