|
Download Data (XLS File) |
|
|||||
|
|||||
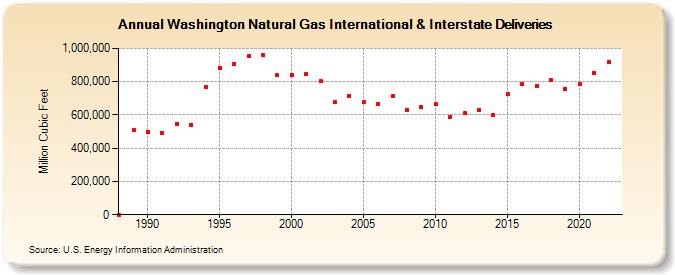
| Washington Natural Gas International & Interstate Deliveries (Million Cubic Feet) | |||||
| Decade | Year-0 | Year-1 | Year-2 | Year-3 | Year-4 | Year-5 | Year-6 | Year-7 | Year-8 | Year-9 |
|---|---|---|---|---|---|---|---|---|---|---|
| 1980's | 0 | 510,333 | ||||||||
| 1990's | 500,269 | 488,666 | 542,972 | 540,711 | 765,840 | 882,990 | 908,055 | 954,325 | 958,094 | 837,942 |
| 2000's | 841,630 | 844,770 | 805,614 | 675,963 | 716,421 | 674,744 | 664,766 | 716,232 | 628,299 | 646,566 |
| 2010's | 662,888 | 586,279 | 610,935 | 631,318 | 596,680 | 727,055 | 785,314 | 772,645 | 812,011 | 757,517 |
| 2020's | 787,742 | 854,804 | 919,247 |
| - = No Data Reported; -- = Not Applicable; NA = Not Available; W = Withheld to avoid disclosure of individual company data. |
| Release Date: 4/30/2024 |
| Next Release Date: 5/31/2024 |