|
Download Data (XLS File) |
|
|||||
|
|||||
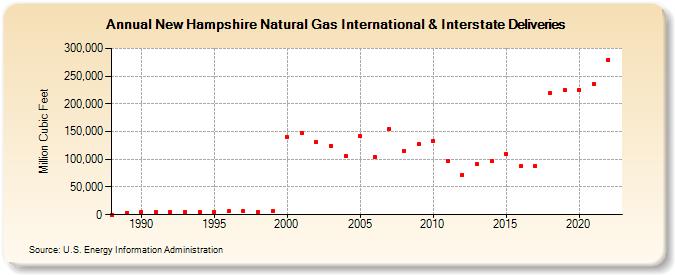
| New Hampshire Natural Gas International & Interstate Deliveries (Million Cubic Feet) | |||||
| Decade | Year-0 | Year-1 | Year-2 | Year-3 | Year-4 | Year-5 | Year-6 | Year-7 | Year-8 | Year-9 |
|---|---|---|---|---|---|---|---|---|---|---|
| 1980's | 0 | 3,657 | ||||||||
| 1990's | 4,457 | 4,815 | 5,135 | 4,962 | 4,884 | 5,521 | 5,888 | 6,433 | 5,728 | 6,597 |
| 2000's | 139,958 | 148,119 | 130,872 | 124,841 | 105,754 | 141,095 | 104,713 | 154,268 | 115,474 | 126,880 |
| 2010's | 132,564 | 96,943 | 72,446 | 90,760 | 96,946 | 109,666 | 87,859 | 88,069 | 219,490 | 225,563 |
| 2020's | 225,689 | 236,319 | 279,926 |
| - = No Data Reported; -- = Not Applicable; NA = Not Available; W = Withheld to avoid disclosure of individual company data. |
| Release Date: 4/30/2024 |
| Next Release Date: 5/31/2024 |